Milos Popovic · GIS consultant

Maps that move, rendered from real geodata.

I make 3D maps and films of terrain, weather, people and cities with forge3d, my own rendering engine, and help teams turn spatial data into maps and products people use.

The west side of La Palma in 3D, draped with the aerial image: black lava runs from the Cumbre Vieja vent down to the sea, its front glowing orange, in October 2021.
Interactive · La Palma, Canary IslandsLa Palma, 85 days of lavaFrom 19 September to 13 December 2021 the Cumbre Vieja eruption buried 1,236 ha of the island under lava. Play the front across real terrain and the aerial image flown before it. Data: IGN, GRAFCAN, Cabildo de La Palma, IGME, Copernicus. Drawn live with forge3d-web (WebGPU).Open the full-page map

Selected work

Films and renders, made with forge3d

Mont Blanc, France

603 million cubic metres of ice, gone

Up to 88 m thinner between IGN surveys, 2004–2023
Zermatt, Switzerland

The Matterhorn lights up before the valley wakes

Alpenglow at sunrise, rendered in 3D
China

190,700 km of expressway in 36 years

Every section drawn the year it opened, 1988–2024
Türkiye

Fifty years of quakes in Türkiye, and one year that dwarfs them

Every Mw 4+ earthquake, 1976–2026; the energy spike is 2023
France

21.1% of France is 65 or older

Share aged 65 and over, 1968–2022
Reykjanes, Iceland

Twelve eruptions in four years

New lava, eruption by eruption, 2021–2025
Switzerland

648 trains running at noon

Every passenger train on a typical Tuesday
Tracy Arm, Alaska

A tsunami 481 metres up a fjord wall

A landslide-driven tsunami, 10 August 2025
UK and Ireland

Fifty years of rain in the UK and Ireland

Wet years lift the pins, dry years sink them, 1975–2025
Europe

A warmer shape of summer

Summer 2026, each day against its 1991–2020 normal
The Netherlands

10.4 million Dutch would live below a 5-metre sea

If the dikes were glass
Paris, France

Paris, from daylight to street light

The Eiffel Tower district in 3D
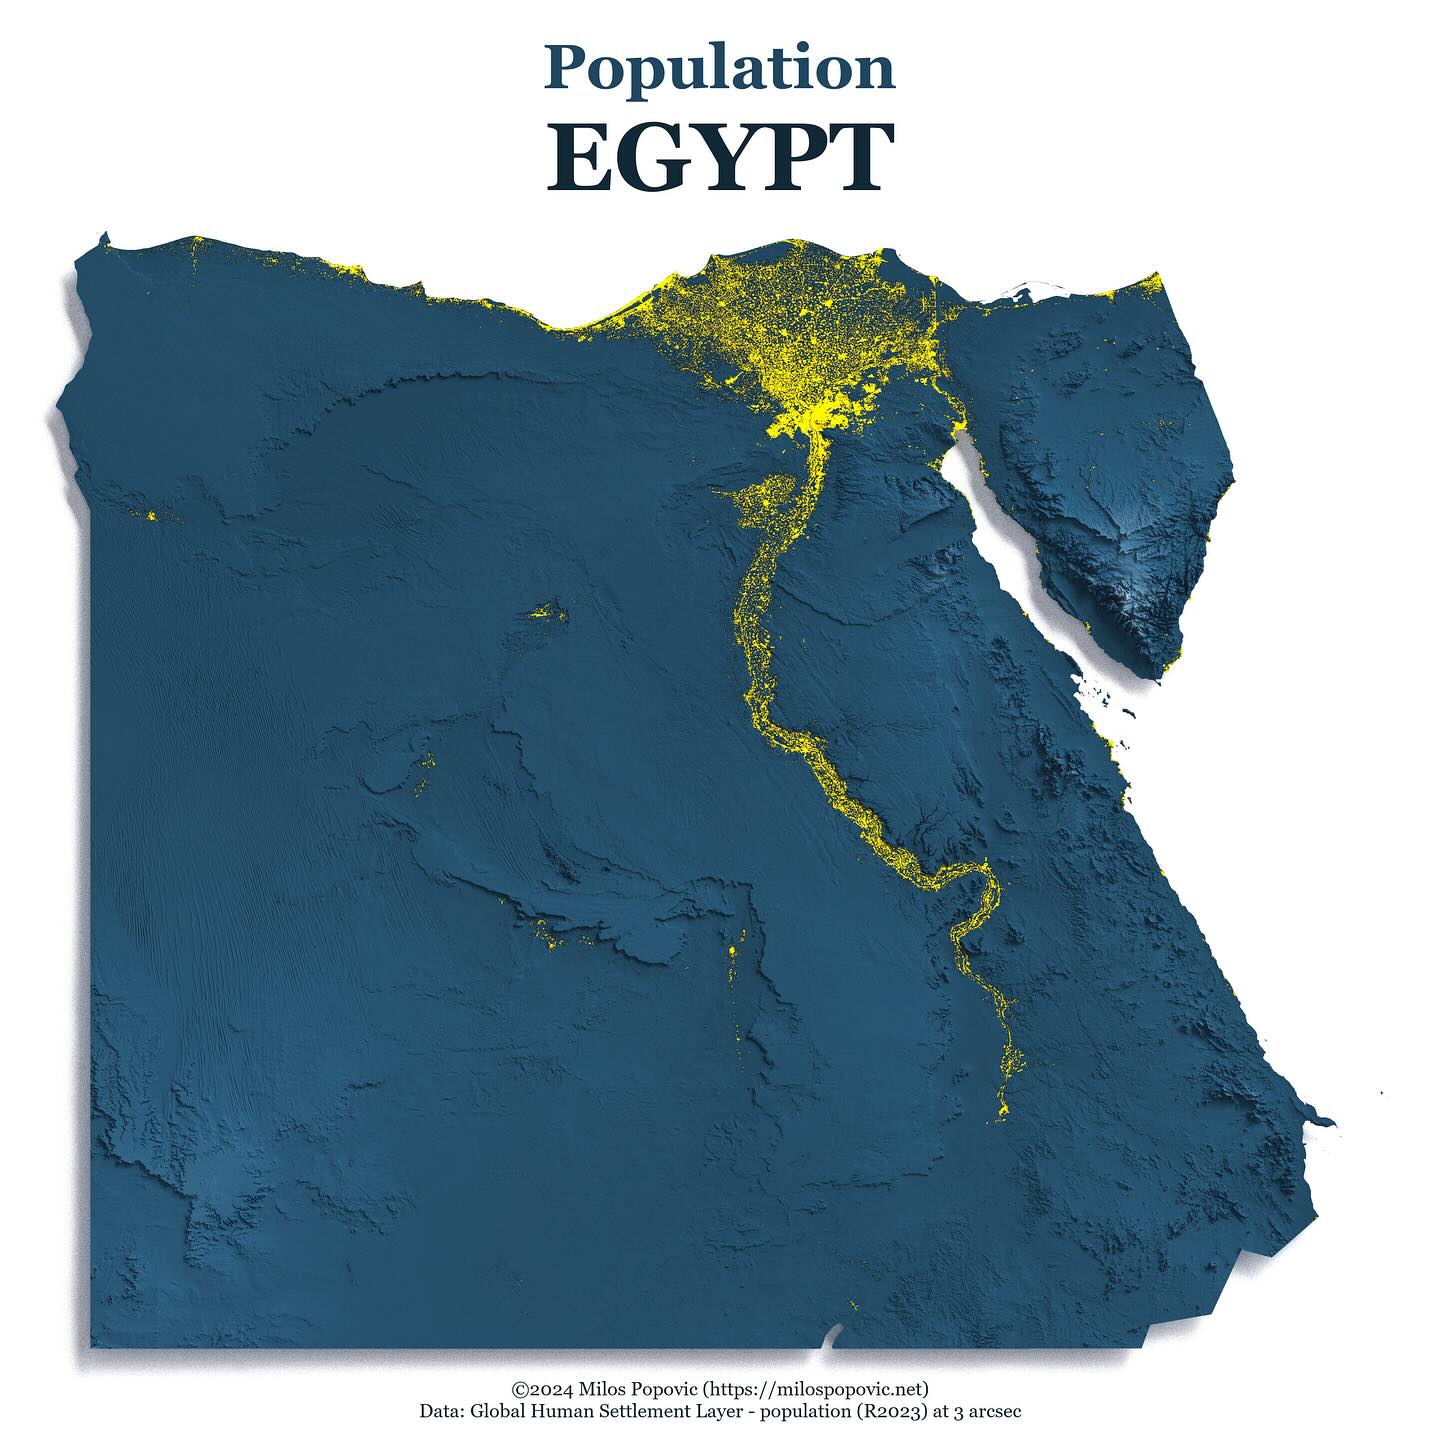
Egypt lives on 4.3% of its land
Egypt

Egypt lives on 4.3% of its land

Every inhabited 90 m cell, along the Nile
Yosemite, California

For a few February evenings, a waterfall turns to fire

Horsetail Fall on El Capitan

Archive

Every map (385)

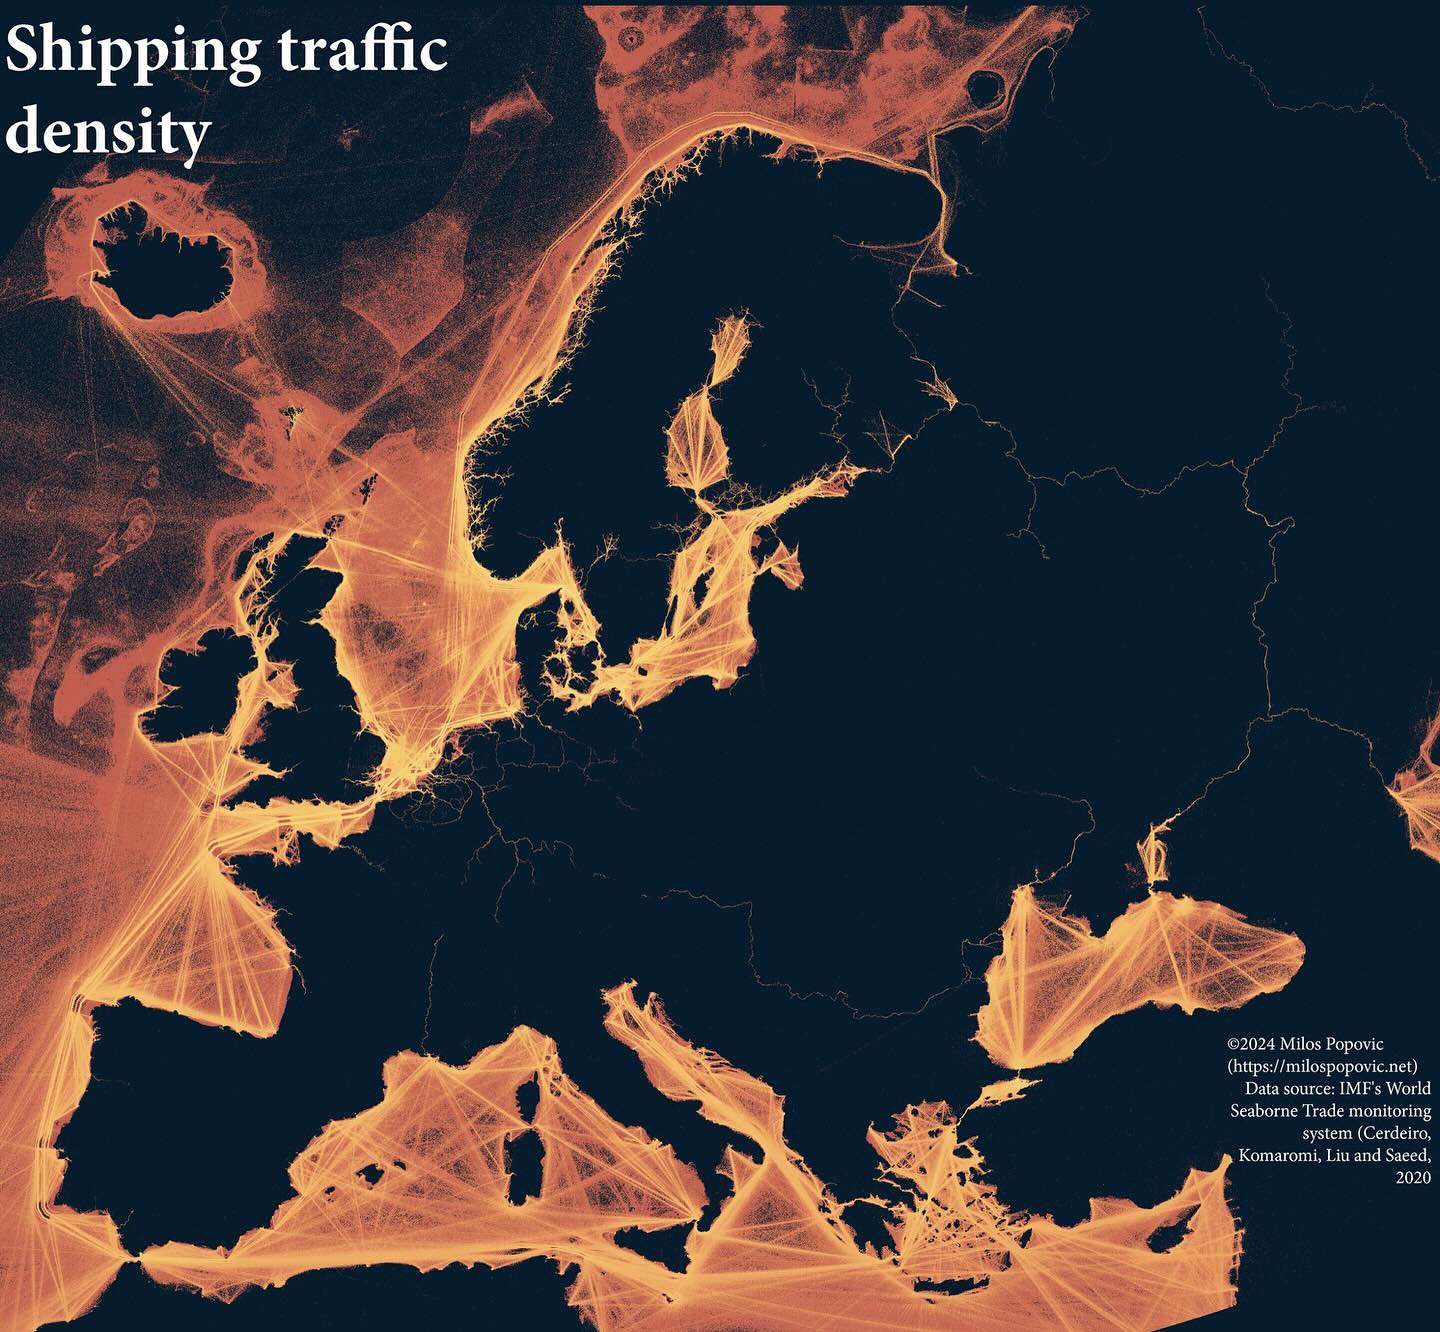
Shipping Traffic Density
Case study

Shipping Traffic Density

A striking visualization showing shipping lane density with glowing lines on a dark background, revealing the arteries of global trade around Europe.
Case study

Nightlight in Ukraine (2021)

A compelling animated visualization of Ukraine's nightlight emissions, highlighting urban centers and infrastructure patterns.
Population of Egypt
Case study

Population of Egypt

A striking 3D population map that immediately communicates how the Nile defines where people live in Egypt, with population shown in yellow against blue terrain.
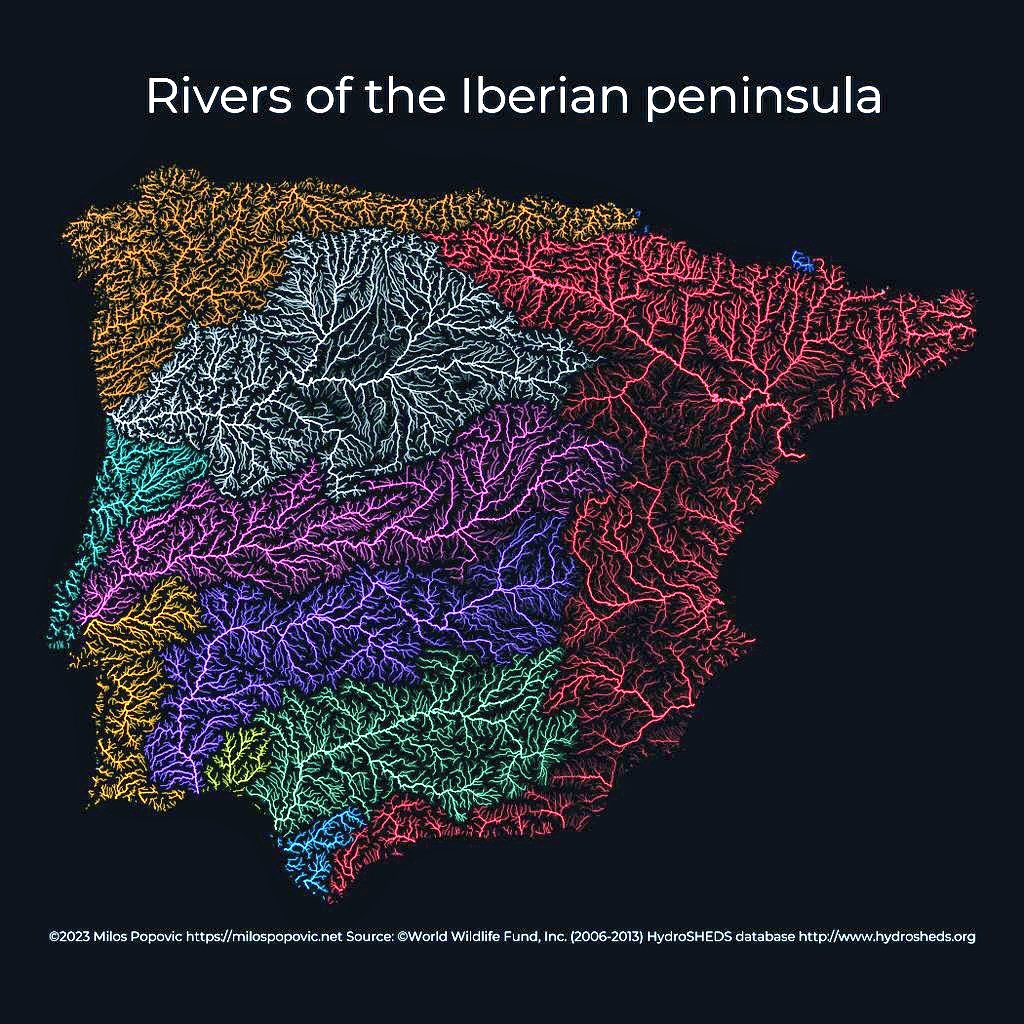
Rivers of the Iberian Peninsula
Case study

Rivers of the Iberian Peninsula
A striking river basin map that uses color to differentiate watersheds while the dark background makes the blue river lines pop dramatically.
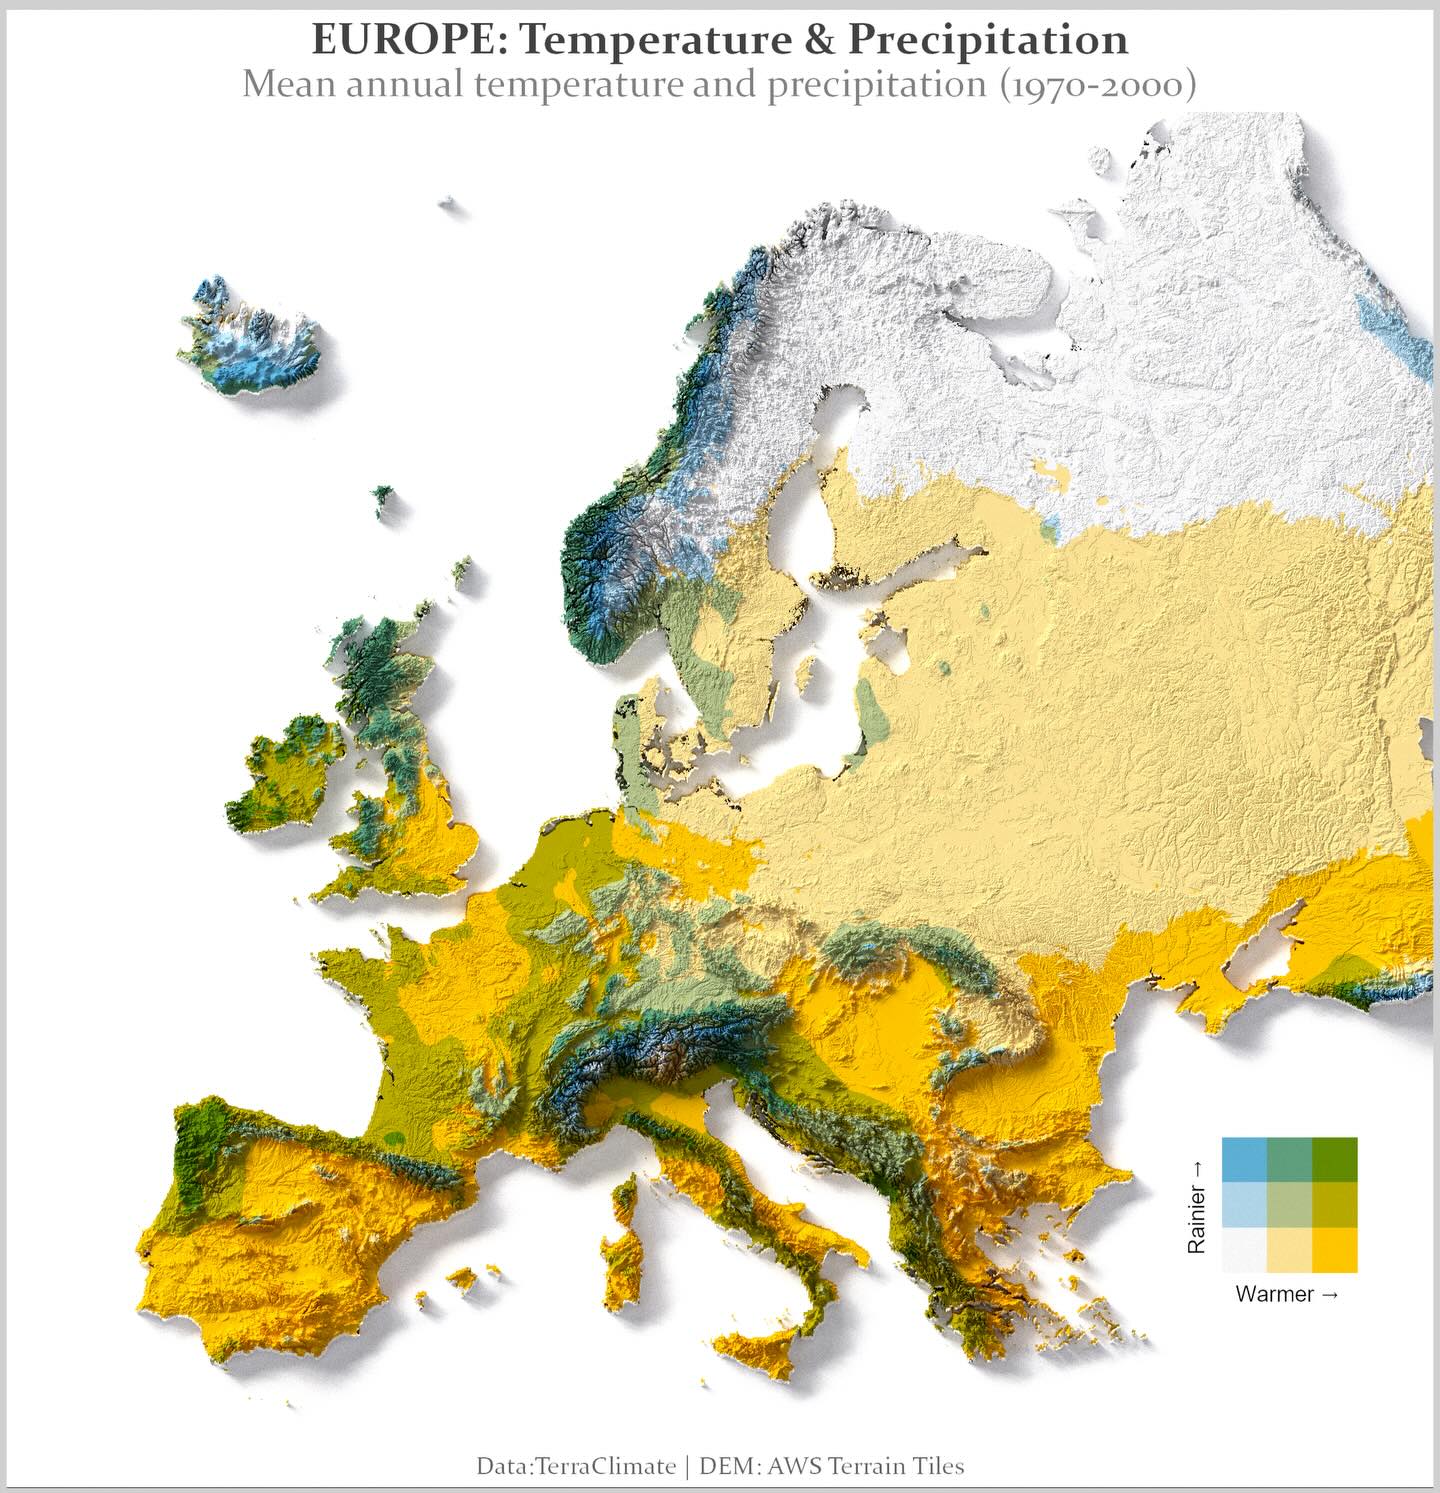
Europe: Temperature & Precipitation
Case study

Europe: Temperature & Precipitation
An elegant bivariate choropleth map that reveals climate patterns across Europe - from warm dry Mediterranean to cold wet Scandinavia - in a single view.
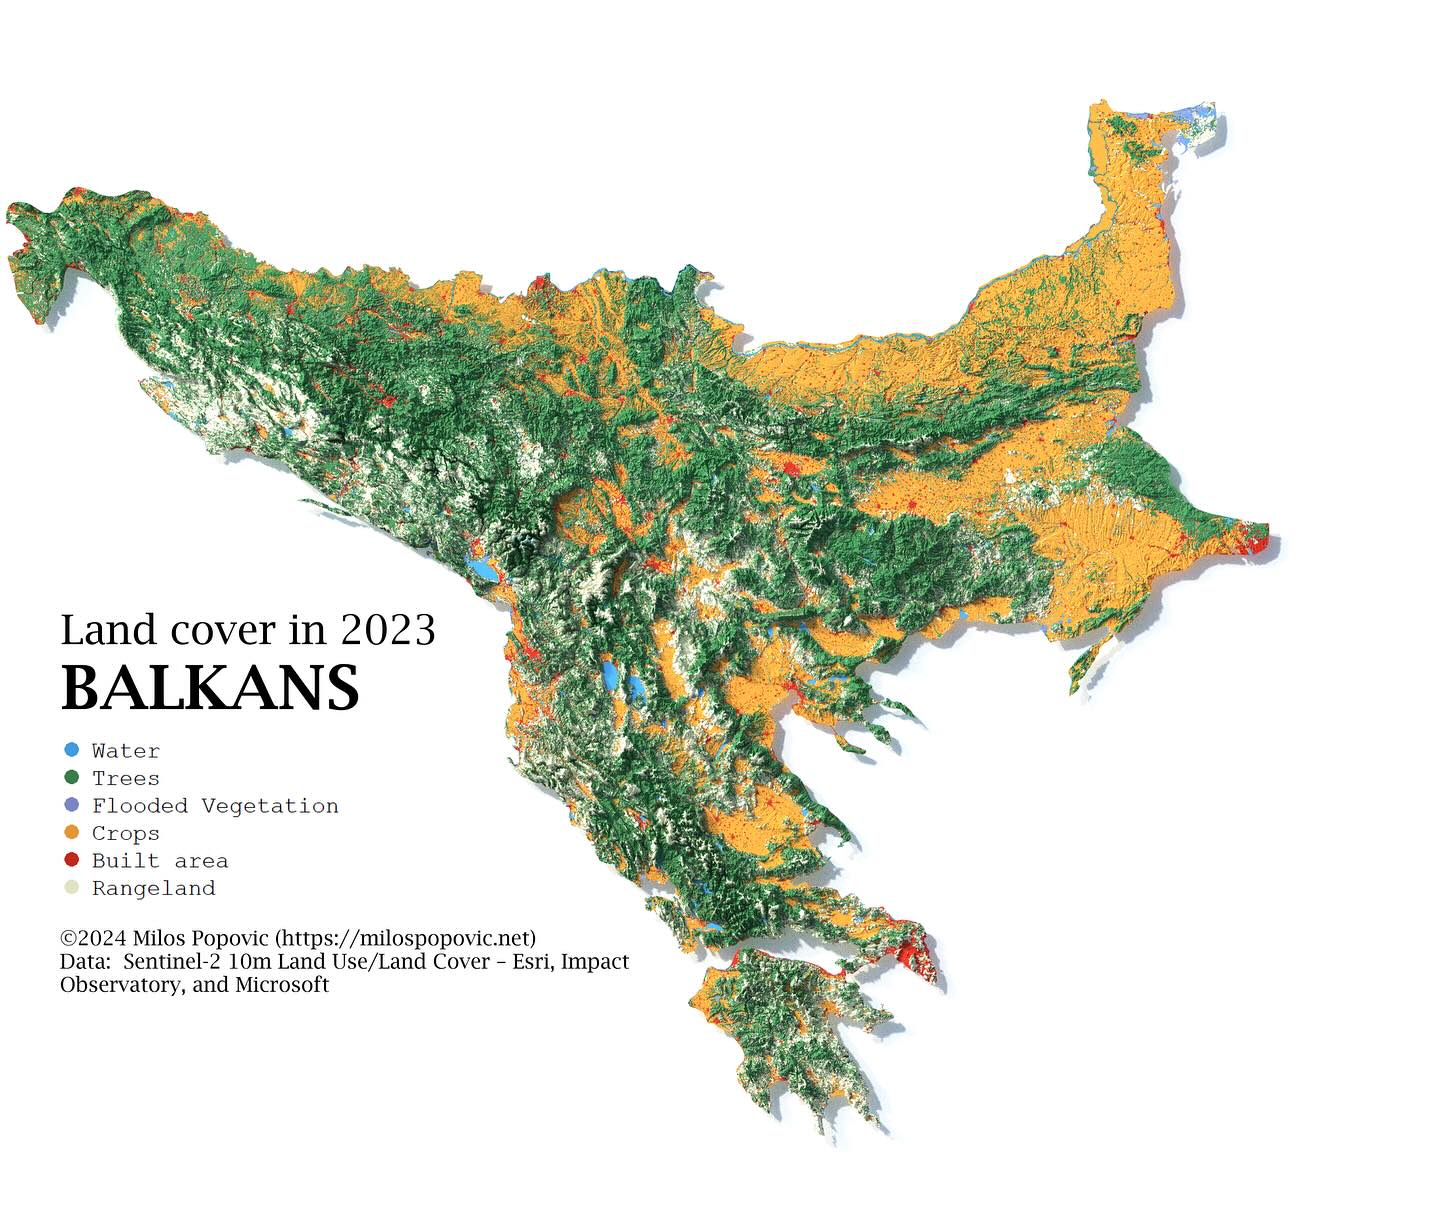
Land Cover in the Balkans
Case study

Land Cover in the Balkans

A comprehensive land cover map that clearly distinguishes between forests, agricultural land, urban areas, and water bodies across the entire Balkans region.
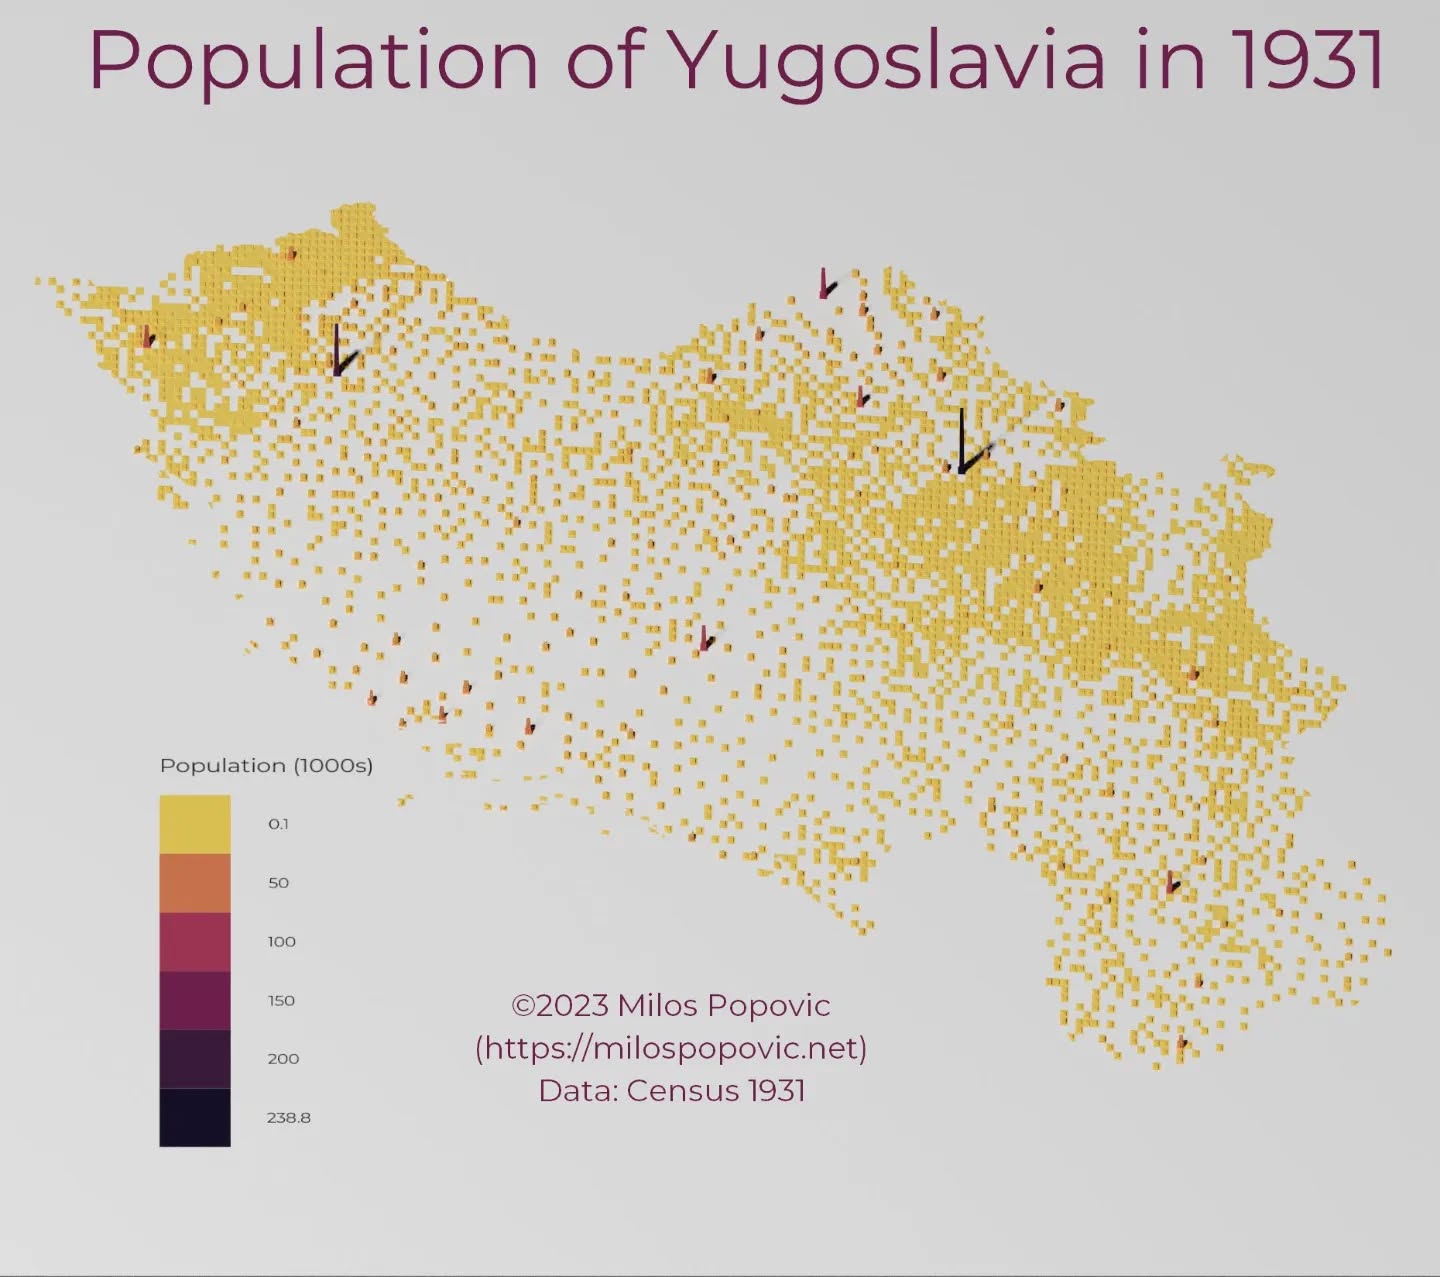
The 1931 Yugoslav Census Data
Interactive

The 1931 Yugoslav Census Data

Interactive exploration of the 1931 Yugoslav Census showing ethnic and religious composition across the Kingdom of Yugoslavia. (opens in a new tab)
The 1931 Yugoslav Census Data (Serbian)
Interactive

The 1931 Yugoslav Census Data (Serbian)

Serbian language version of the interactive 1931 Yugoslav Census visualization. (opens in a new tab)
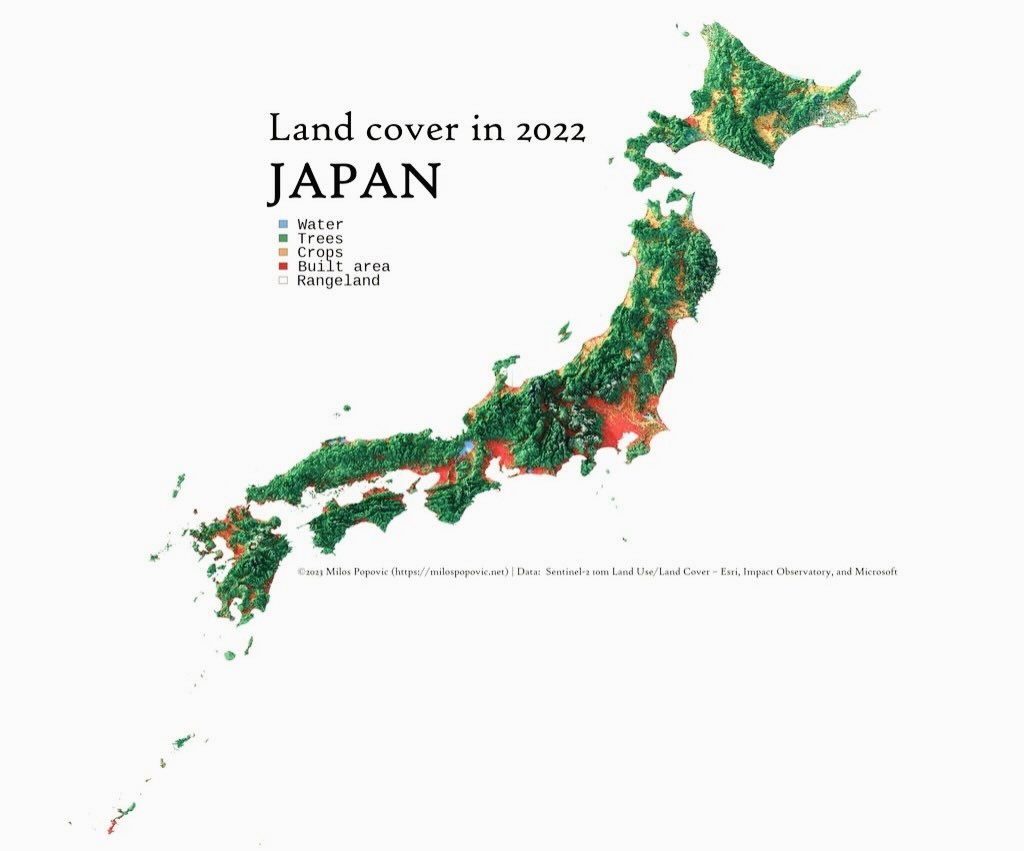
Land cover in 2022 JAPAN
Map

Land cover in 2022 JAPAN

A land cover map of Japan showing the distribution of water, trees, crops, built areas, and rangeland across the Japanese archipelago. · Opens image in a new tab
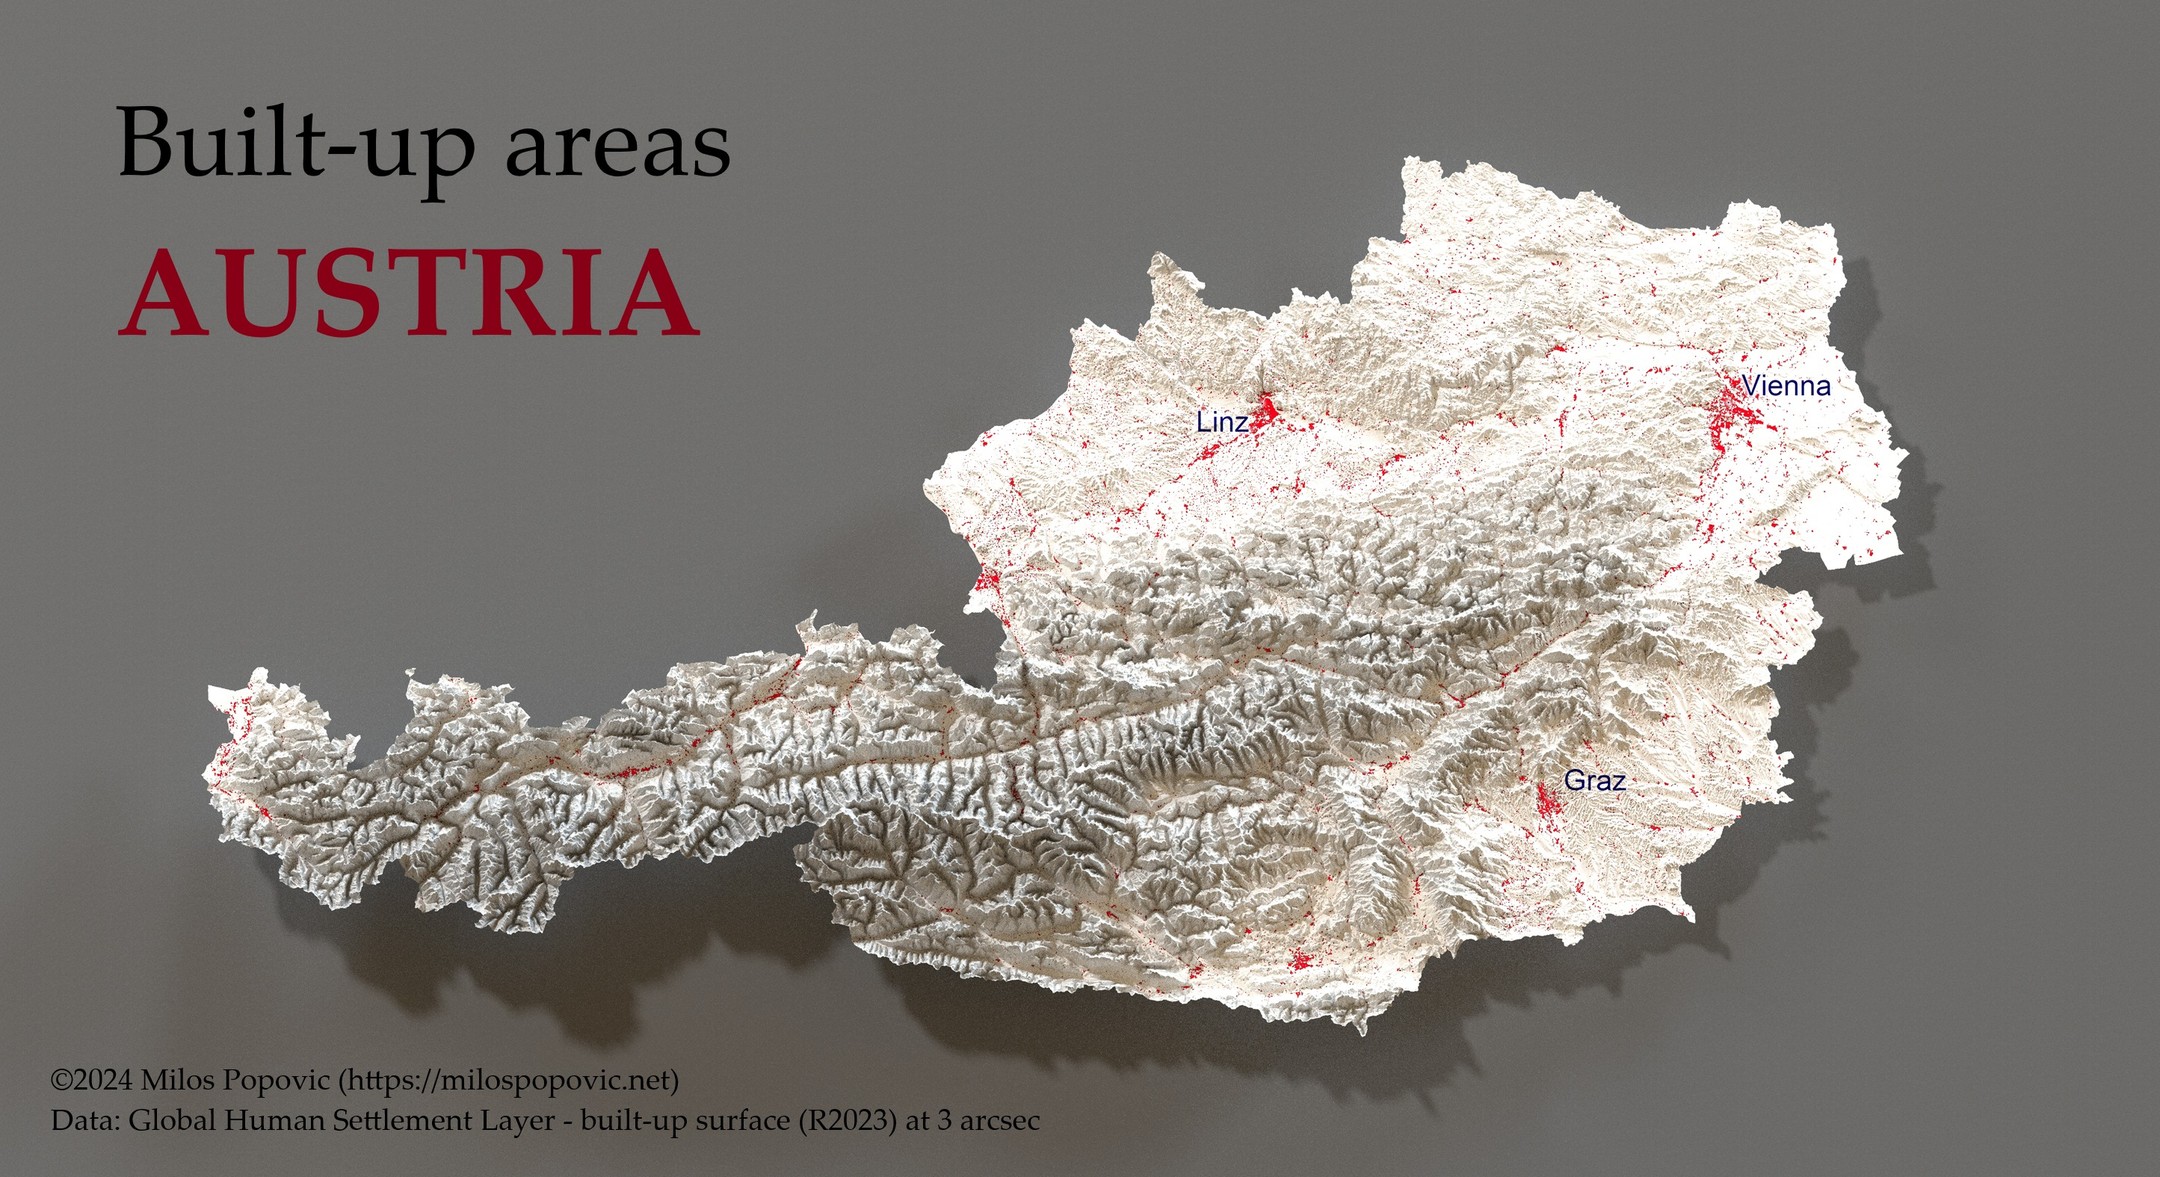
Built-up areas AUSTRIA
3D map

Built-up areas AUSTRIA

A 3D relief map of Austria highlighting built-up urban areas in red, with major cities Vienna, Linz, and Graz labeled. · Opens image in a new tab
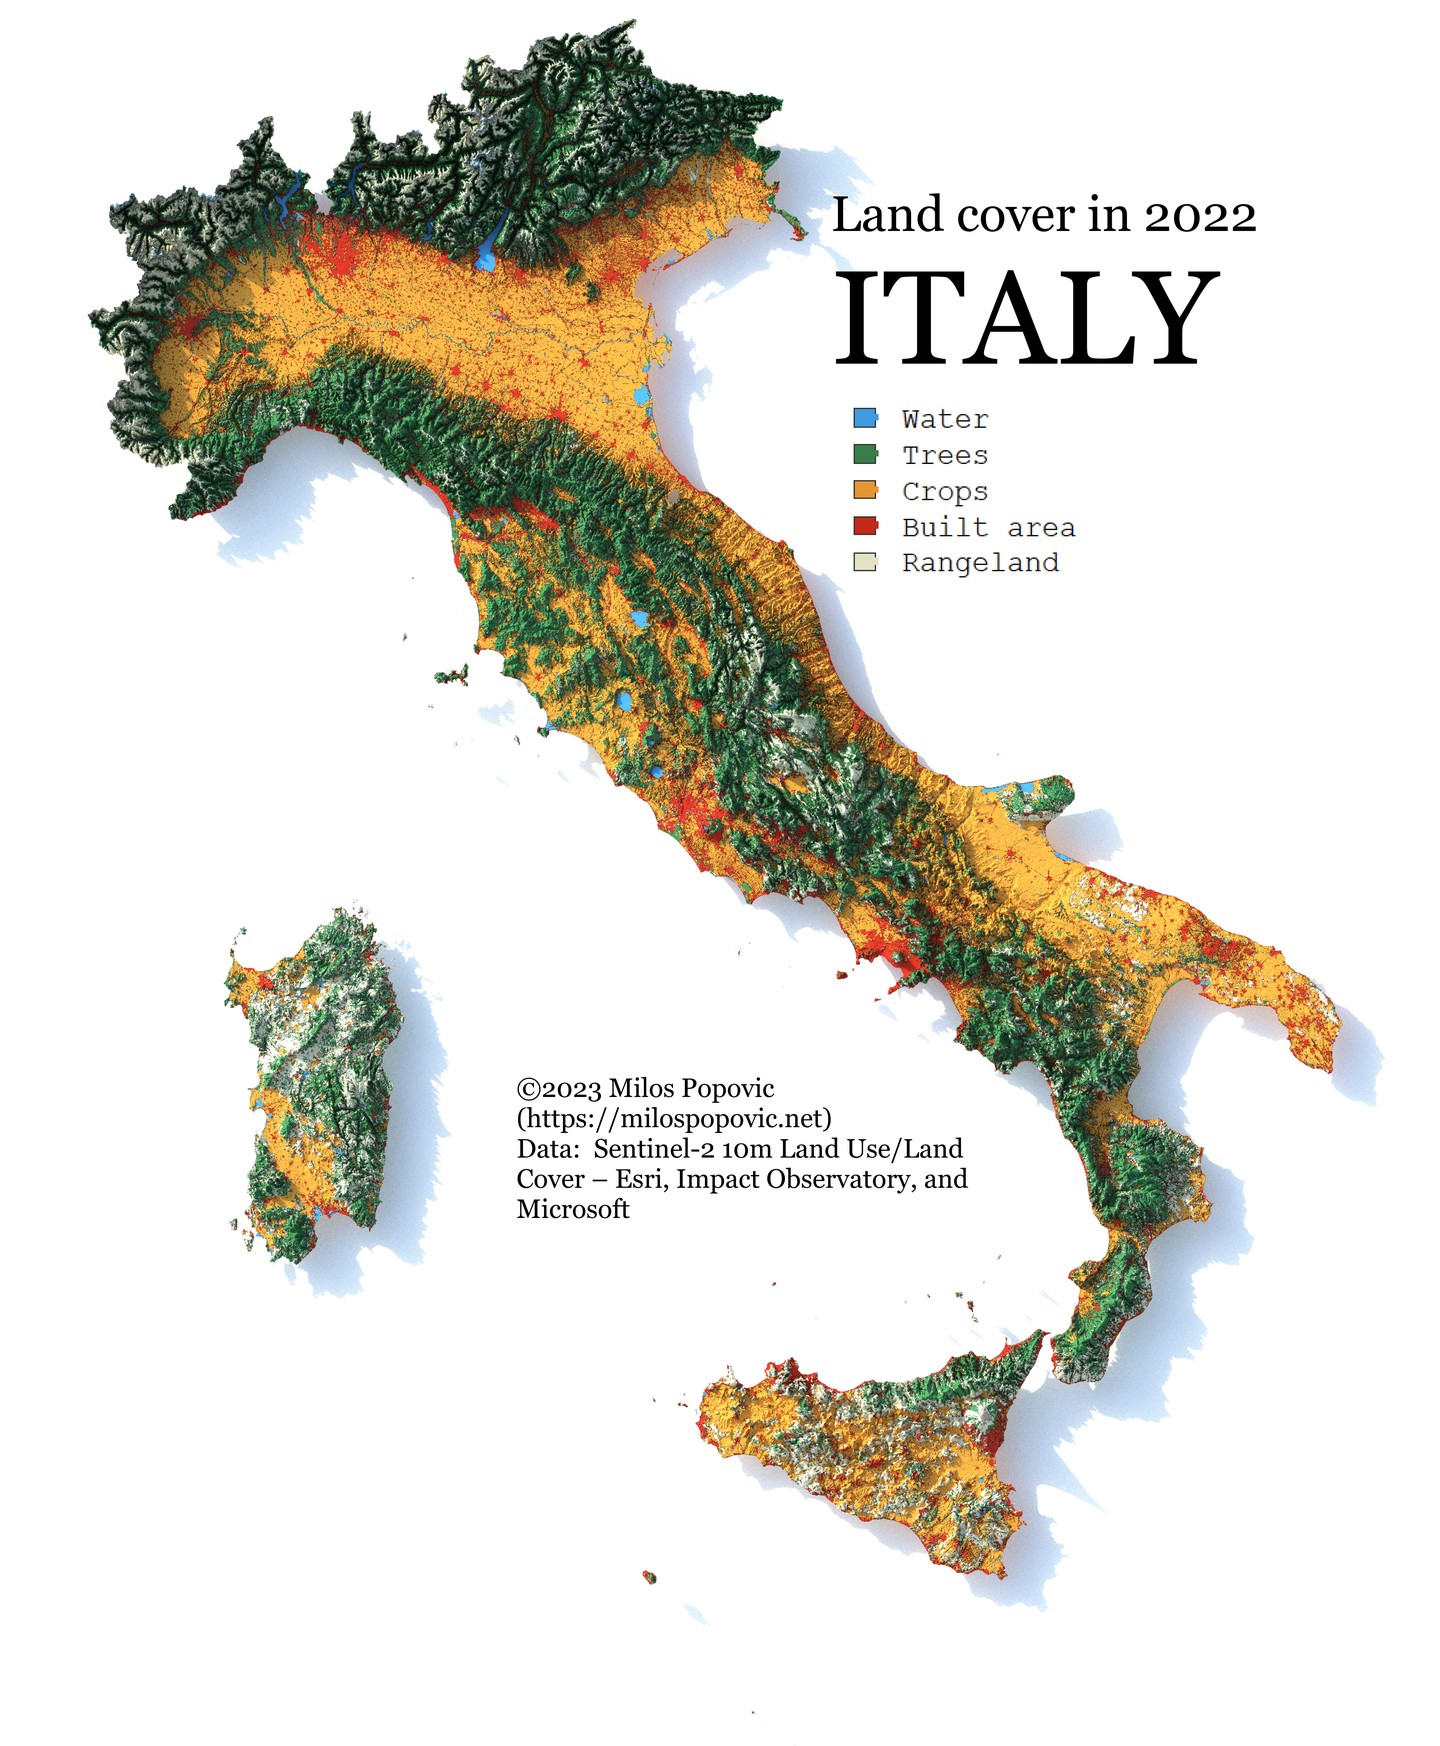
Land cover in 2022 ITALY
Map

Land cover in 2022 ITALY

A land cover map of Italy showing the distribution of water, trees, crops, built areas, and rangeland across the Italian peninsula and islands. · Opens image in a new tab
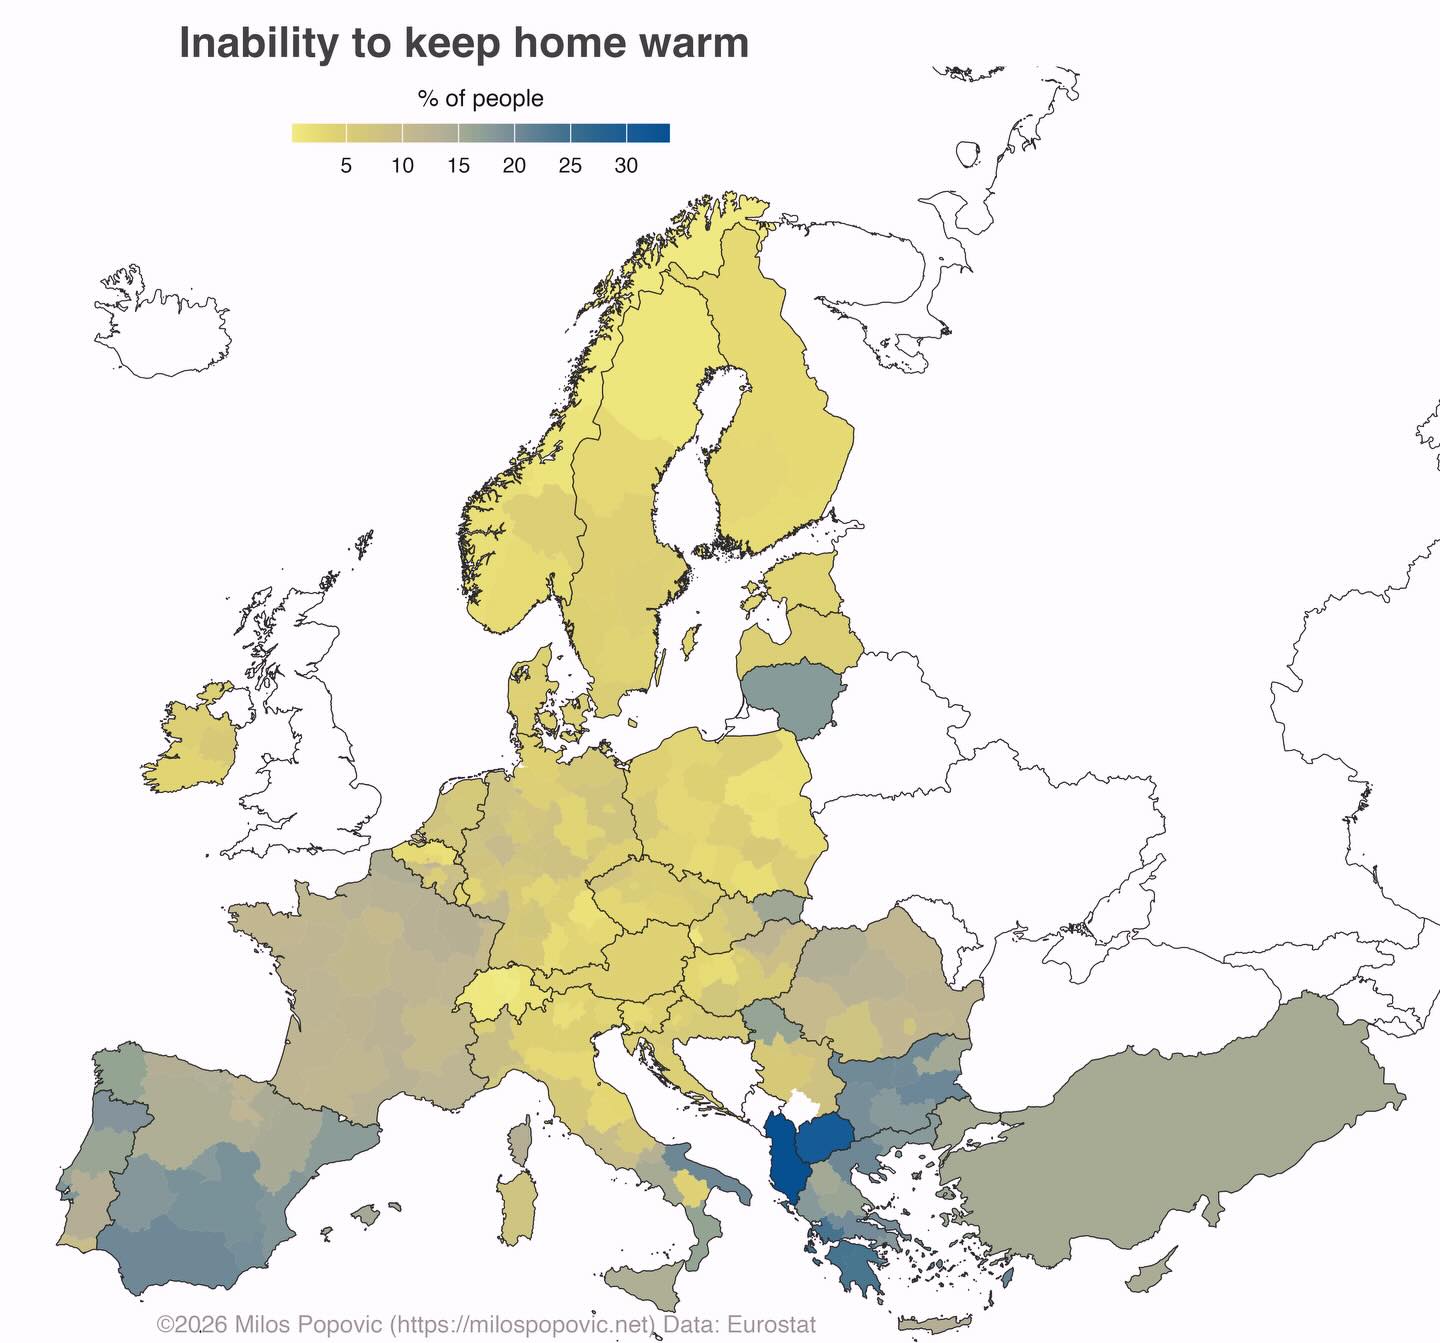
Inability to keep home warm
Map

Inability to keep home warm

A choropleth map of Europe showing the percentage of people unable to keep their homes warm, with regional variations across EU member states. · Opens image in a new tab
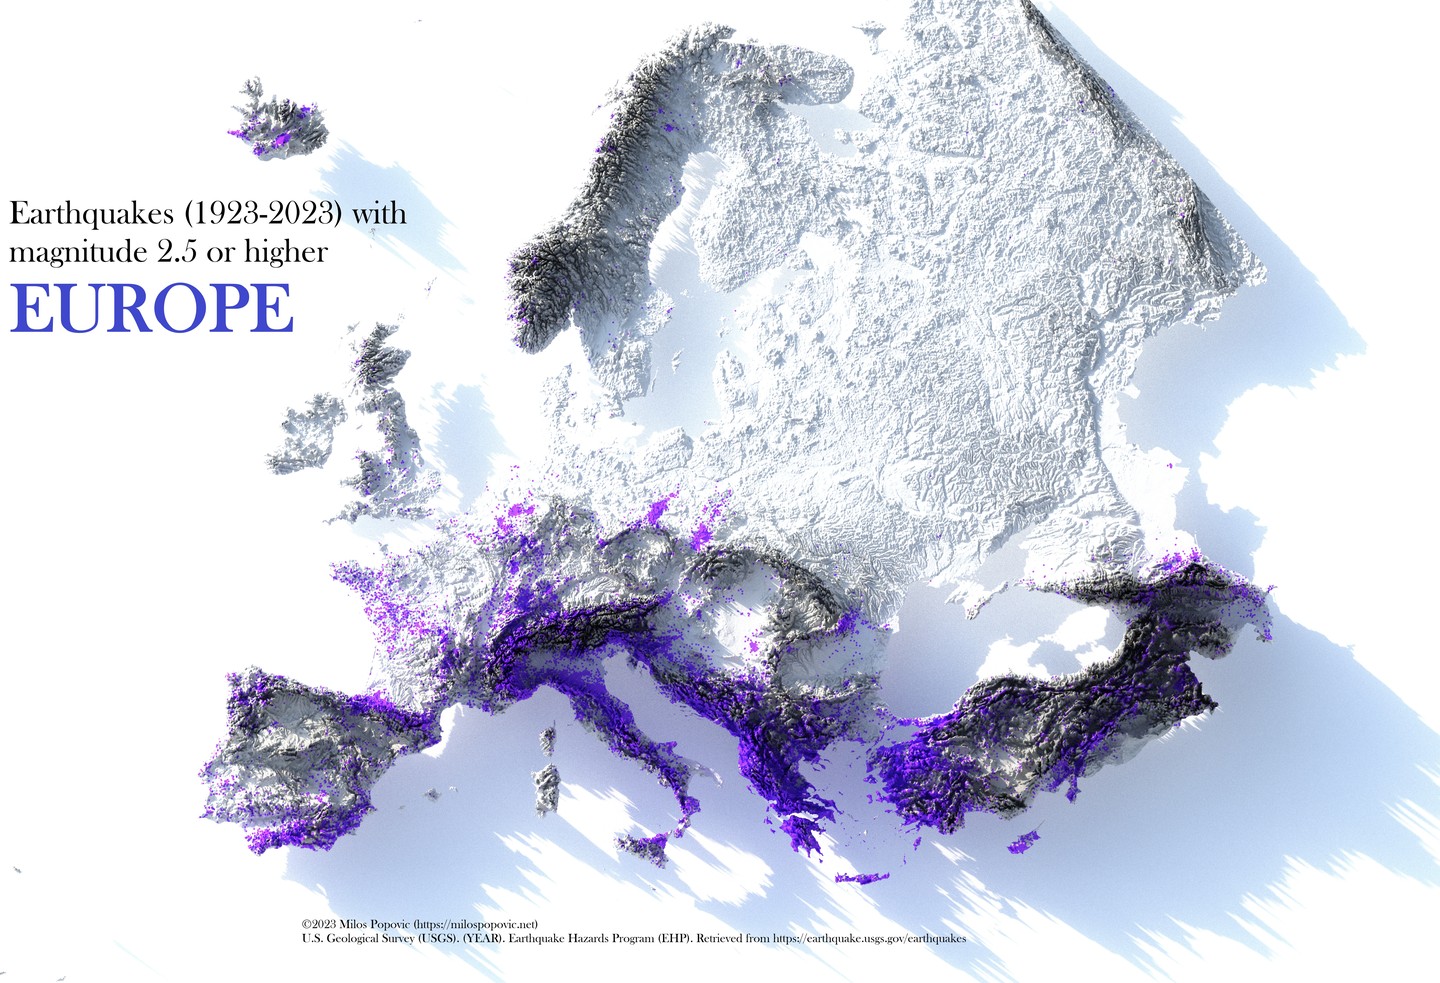
Earthquakes (1923-2023) EUROPE
3D map

Earthquakes (1923-2023) EUROPE
A 3D relief map of Europe showing earthquake locations over 100 years, with seismic activity concentrated along tectonic boundaries in southern Europe. · Opens image in a new tab
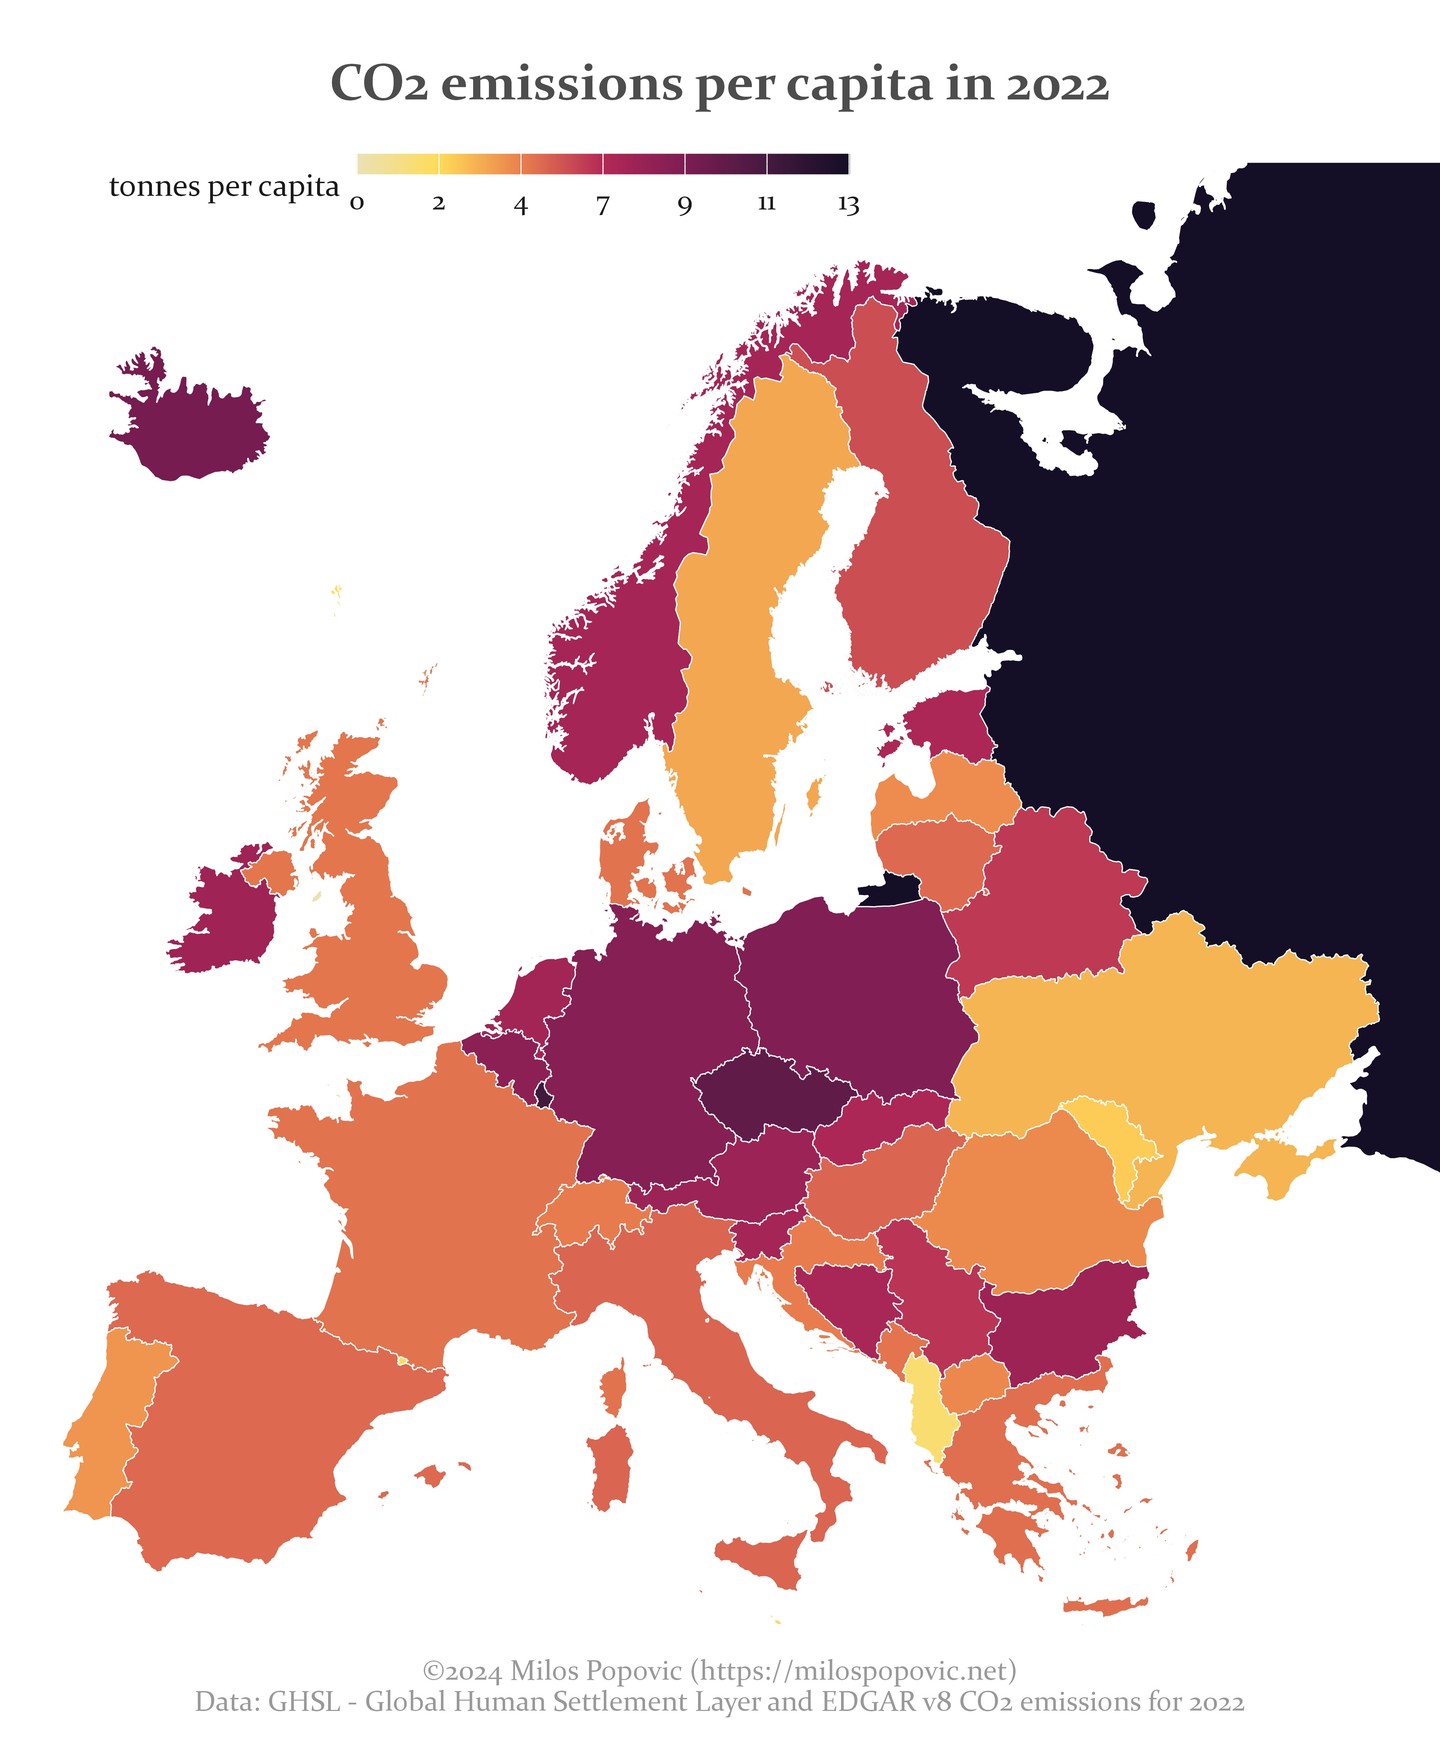
CO2 emissions per capita in 2022
Map

CO2 emissions per capita in 2022

A choropleth map of Europe showing CO2 emissions per capita in tonnes, with variations across countries. · Opens image in a new tab
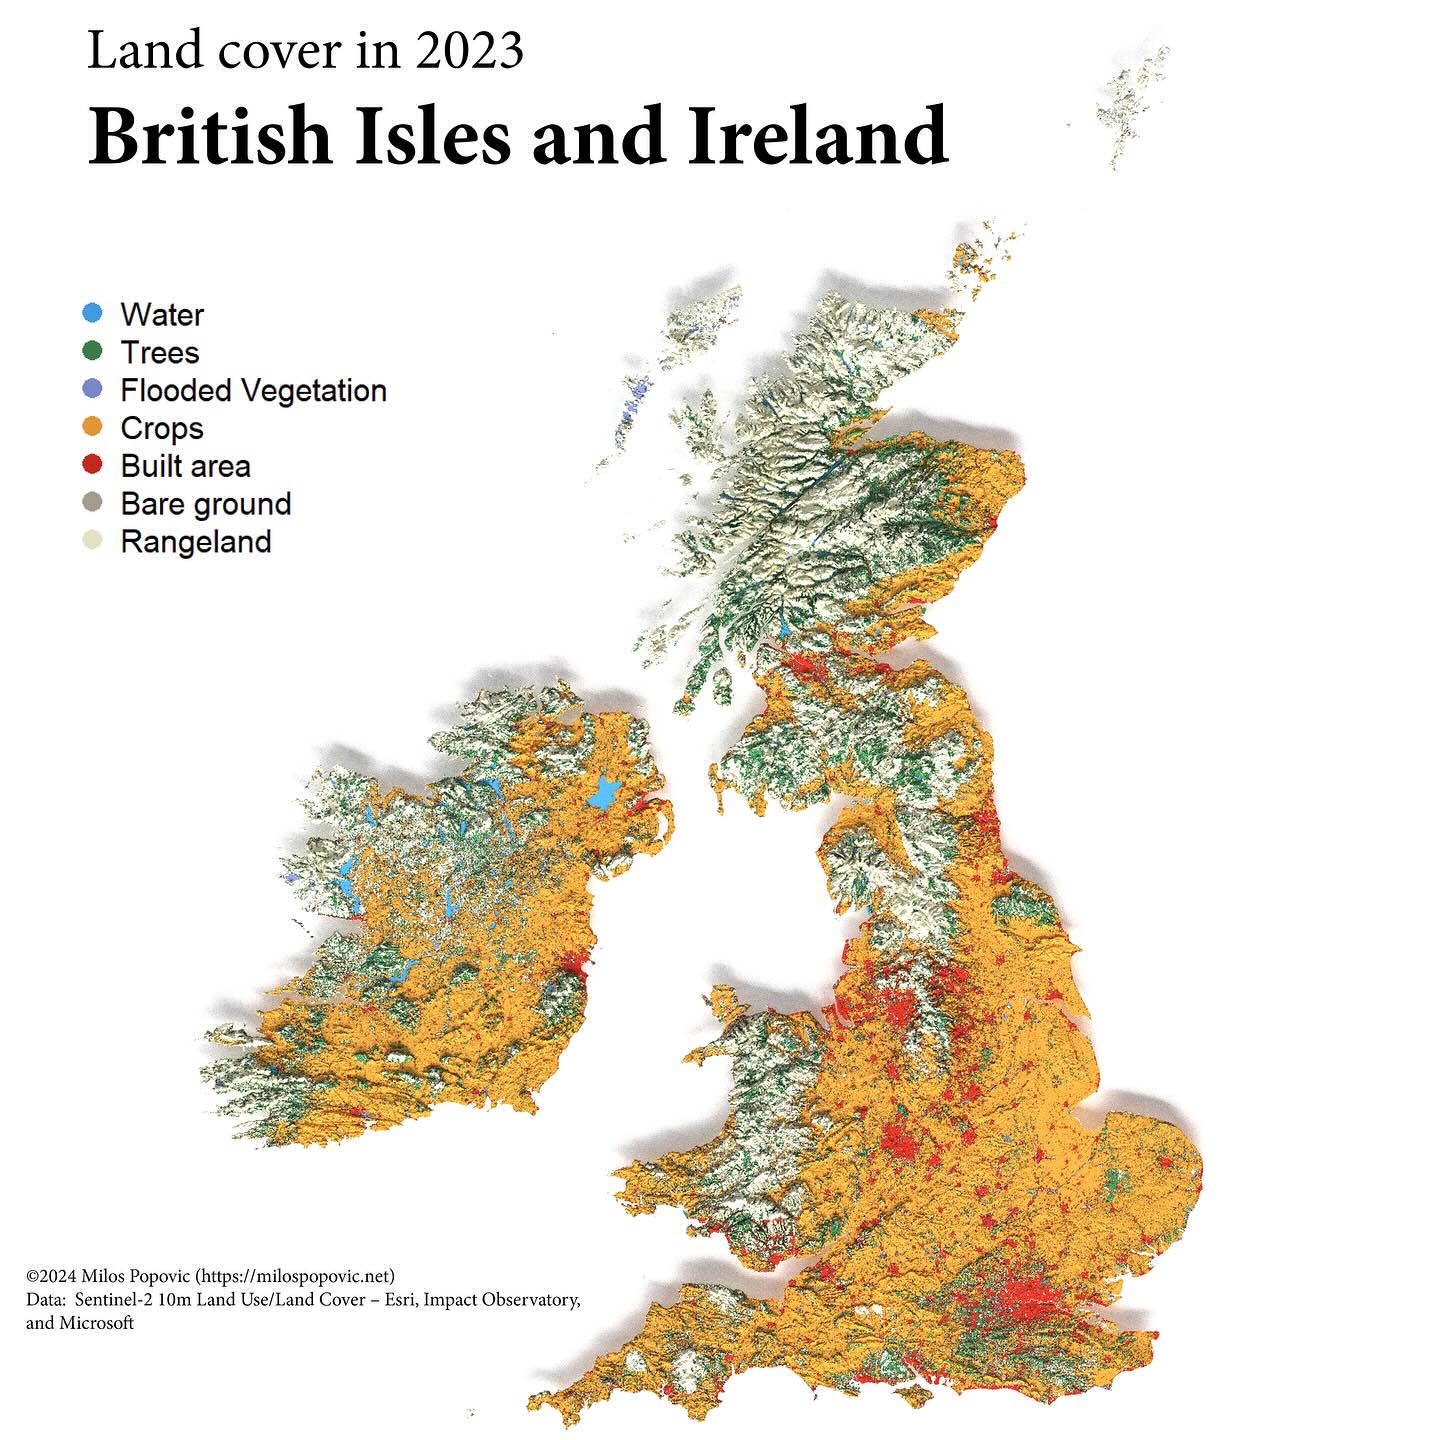
Land cover in 2023 British Isles
Map

Land cover in 2023 British Isles

A land cover map of the British Isles showing water, trees, flooded vegetation, crops, built areas, bare ground, and rangeland distribution. · Opens image in a new tab
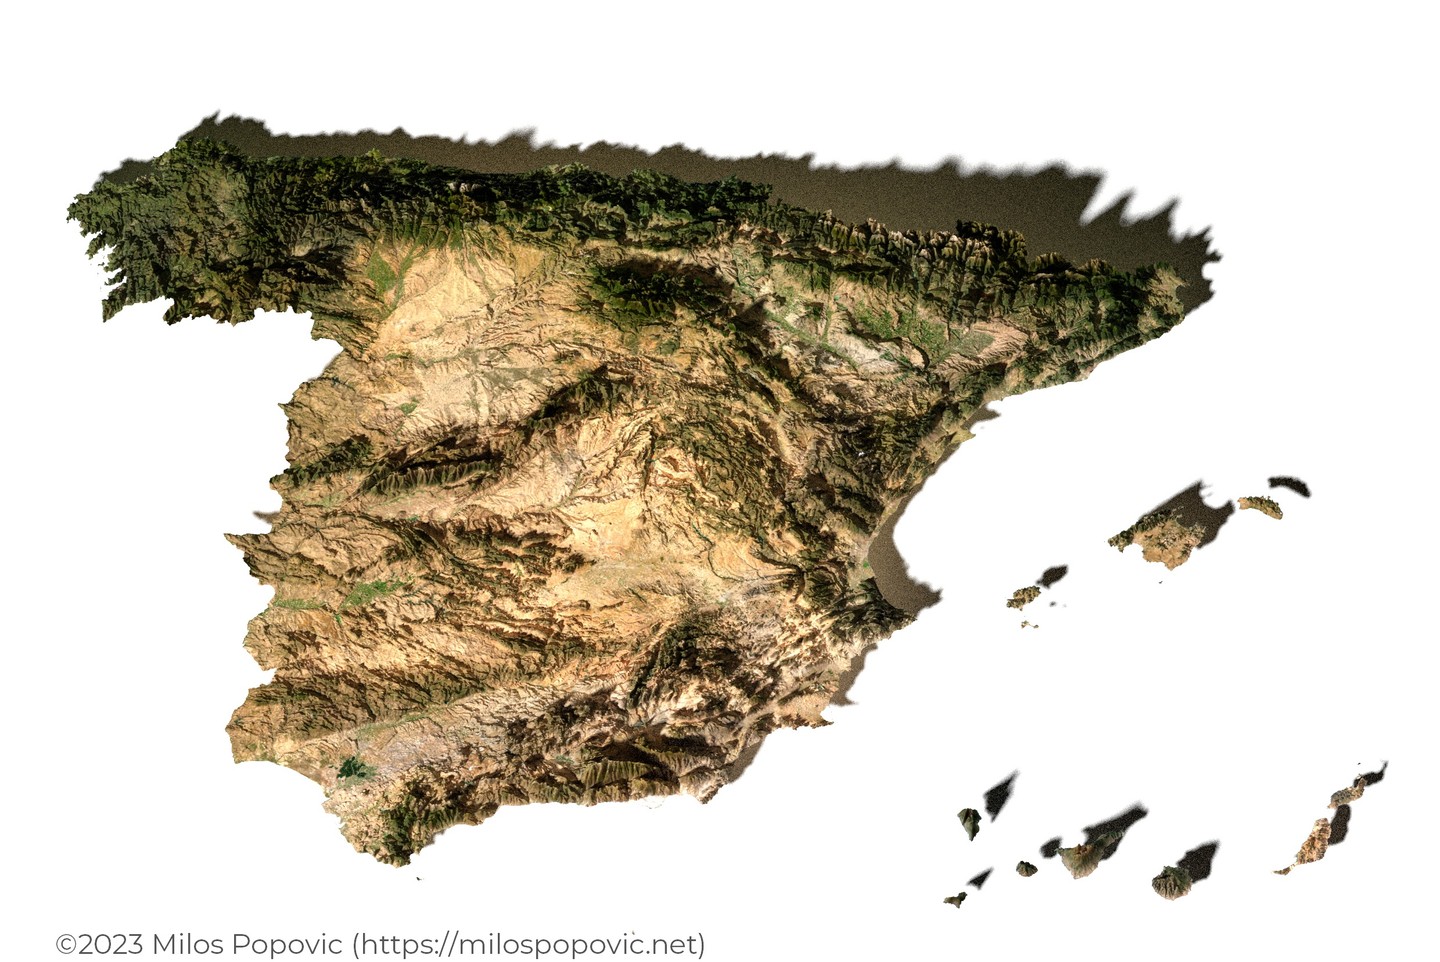
Spain 3D Relief
3D map

Spain 3D Relief

A 3D satellite imagery render of Spain and the Balearic Islands showing topography and land surface features. · Opens image in a new tab
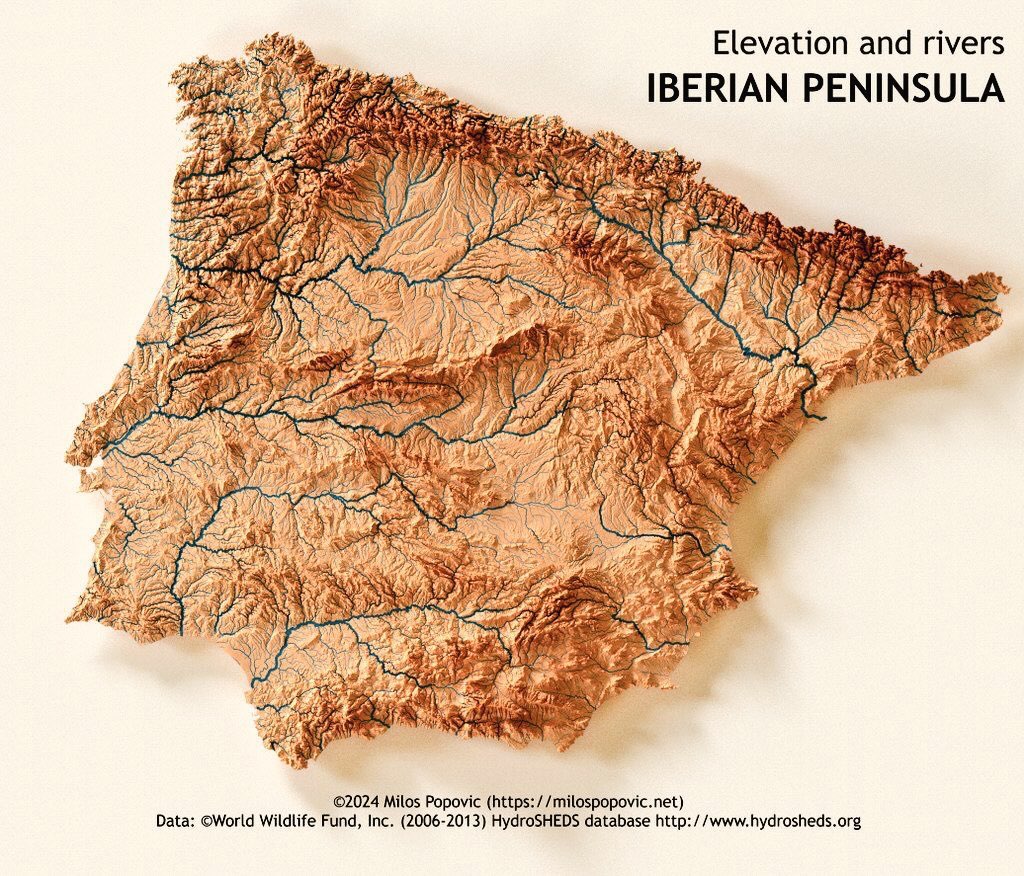
Elevation and rivers IBERIAN PENINSULA
Map

Elevation and rivers IBERIAN PENINSULA

A relief map of the Iberian Peninsula showing elevation with river networks overlaid in blue, highlighting major watersheds. · Opens image in a new tab
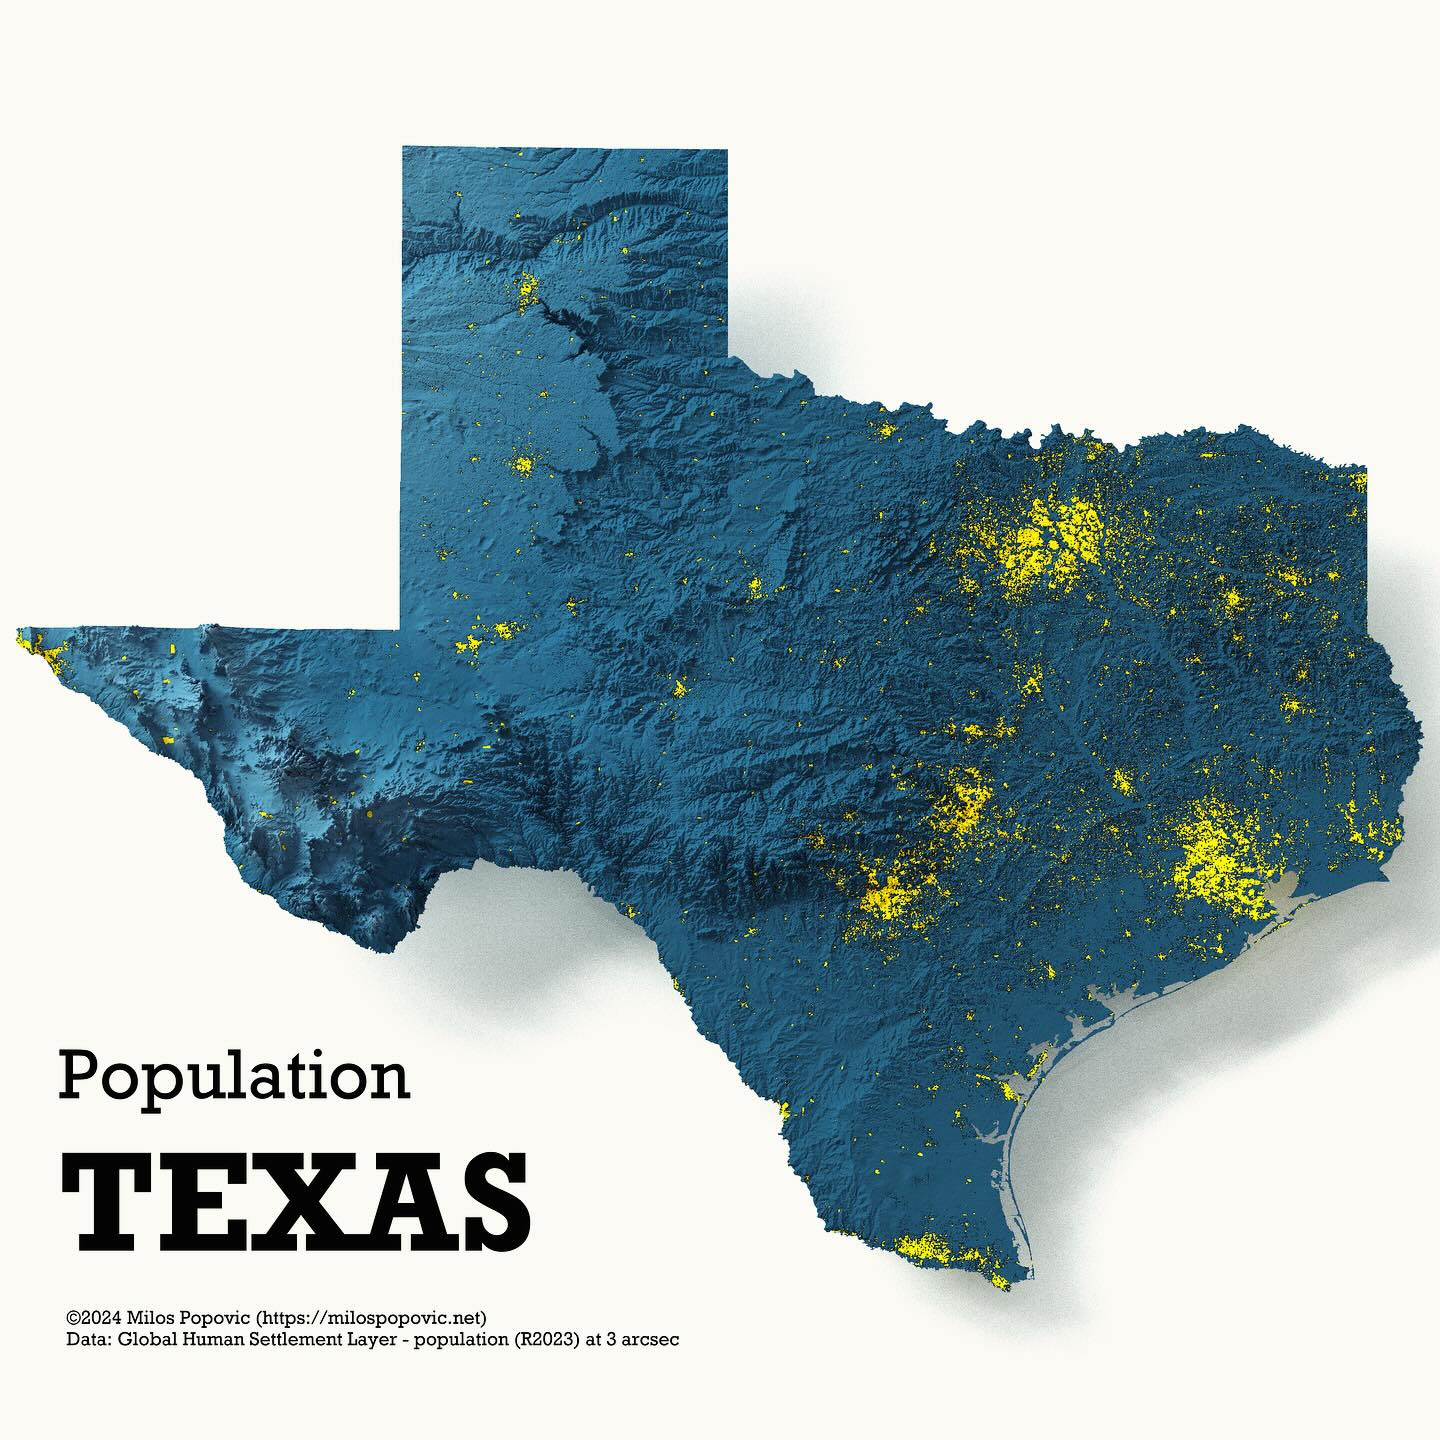
Population TEXAS
3D map

Population TEXAS

A 3D population density map of Texas showing population distribution with yellow highlights indicating populated areas on a blue relief background. · Opens image in a new tab
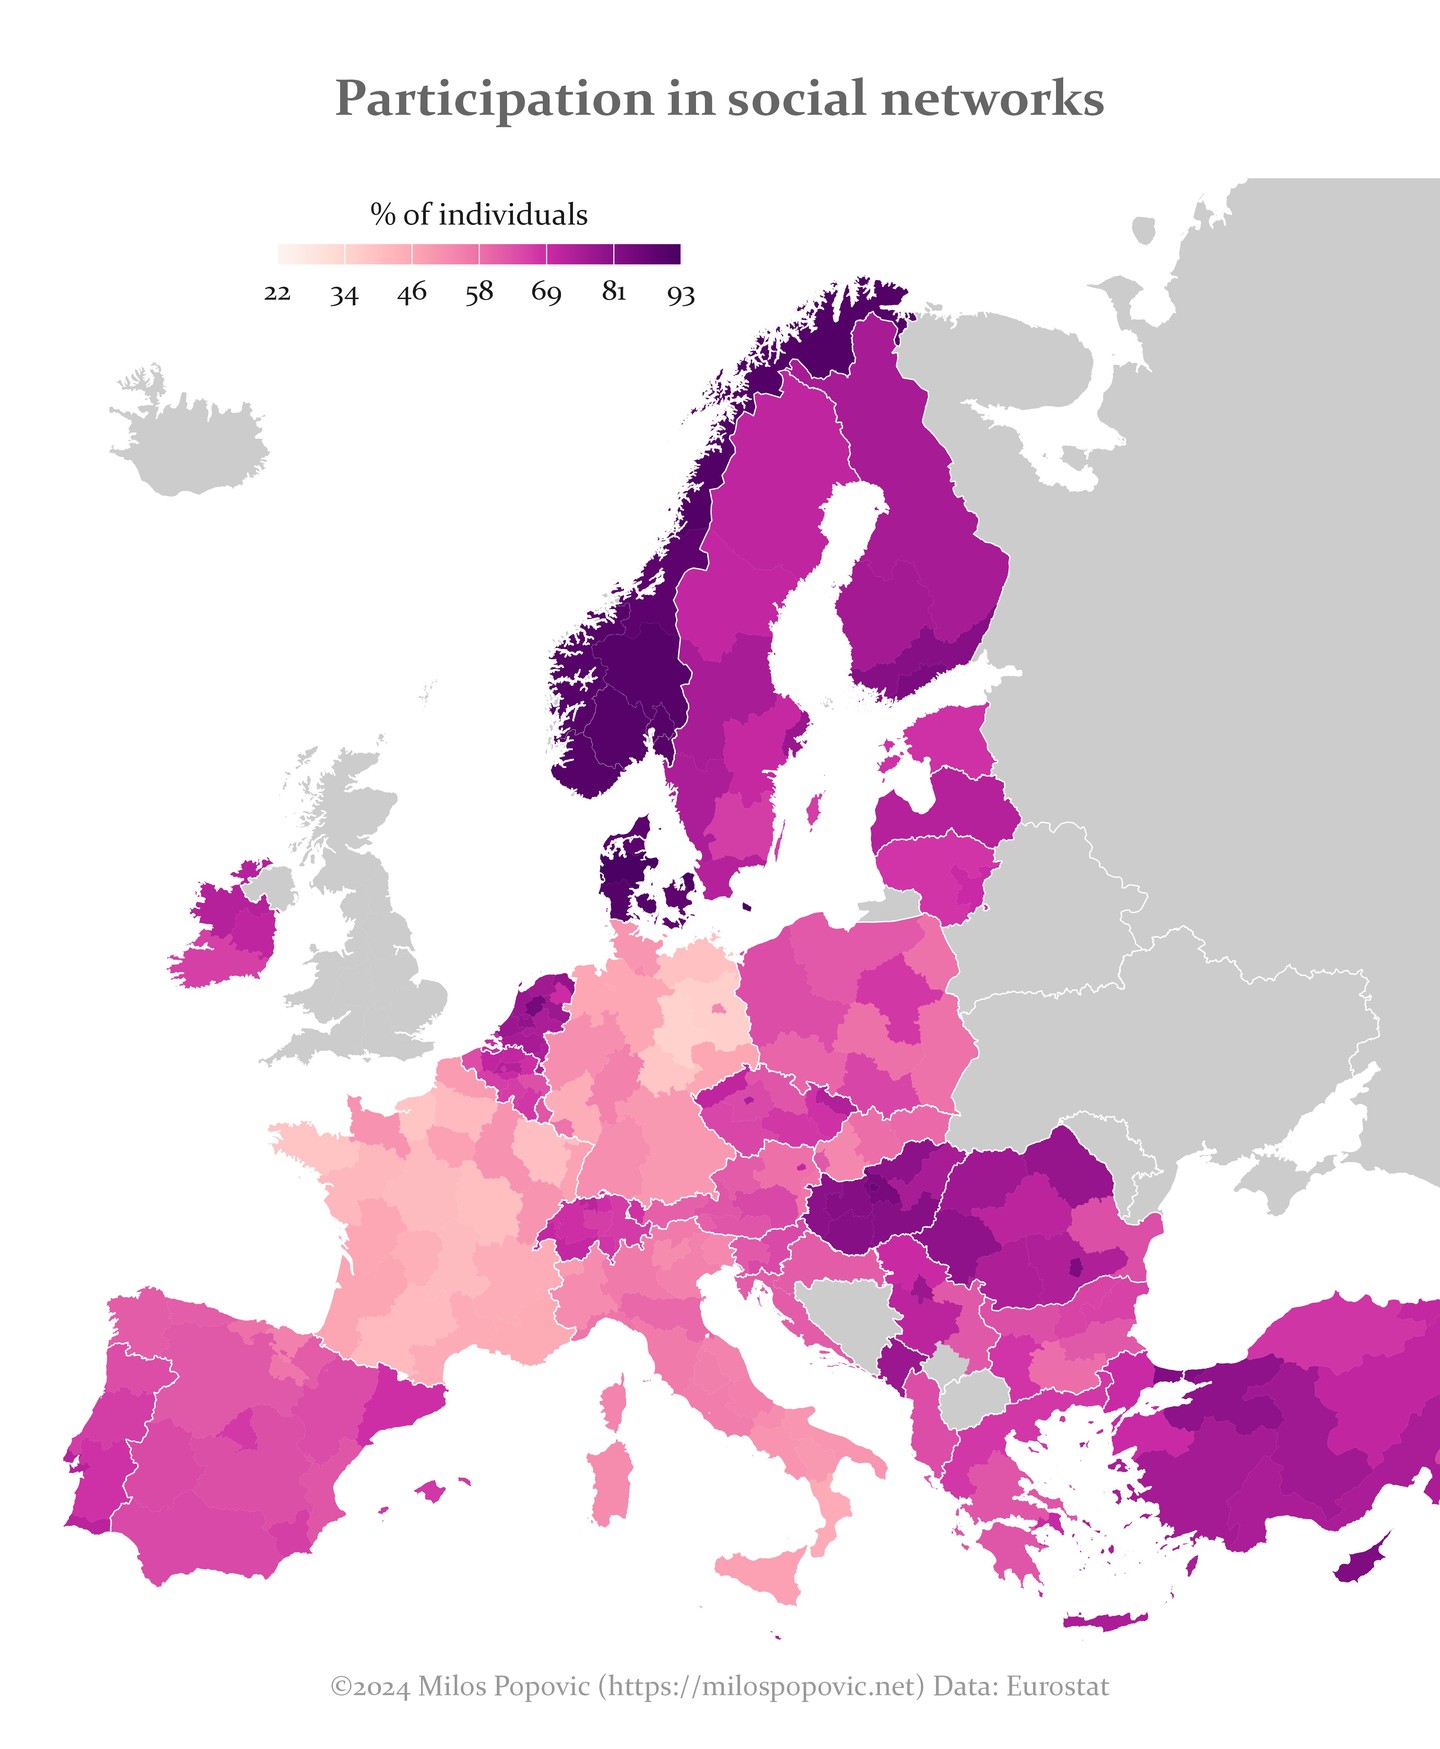
Participation in social networks
Map

Participation in social networks

A choropleth map of Europe showing the percentage of individuals participating in social networks, ranging from 22% to 93%. · Opens image in a new tab
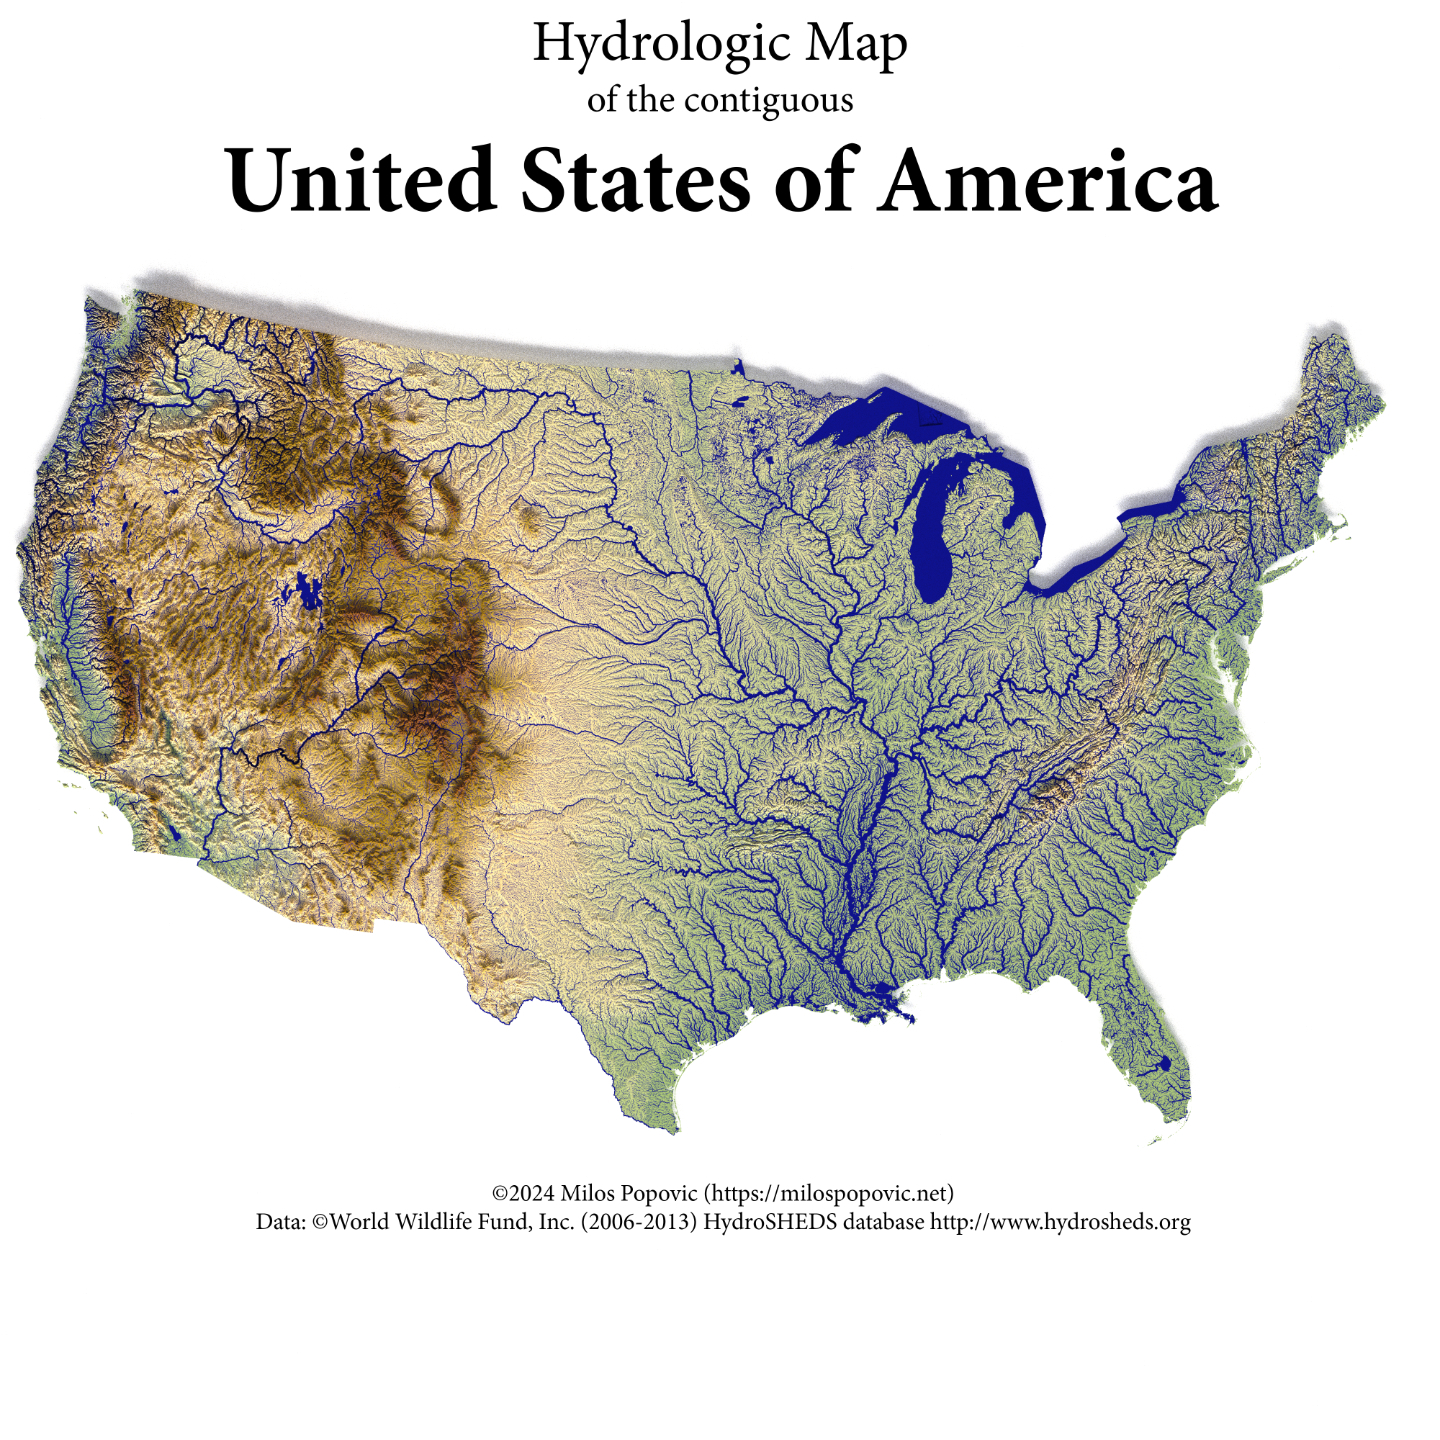
Hydrologic Map of the contiguous United States
Map

Hydrologic Map of the contiguous United States

A hydrologic map showing the river networks and watersheds across the contiguous United States, with elevation coloring. · Opens image in a new tab
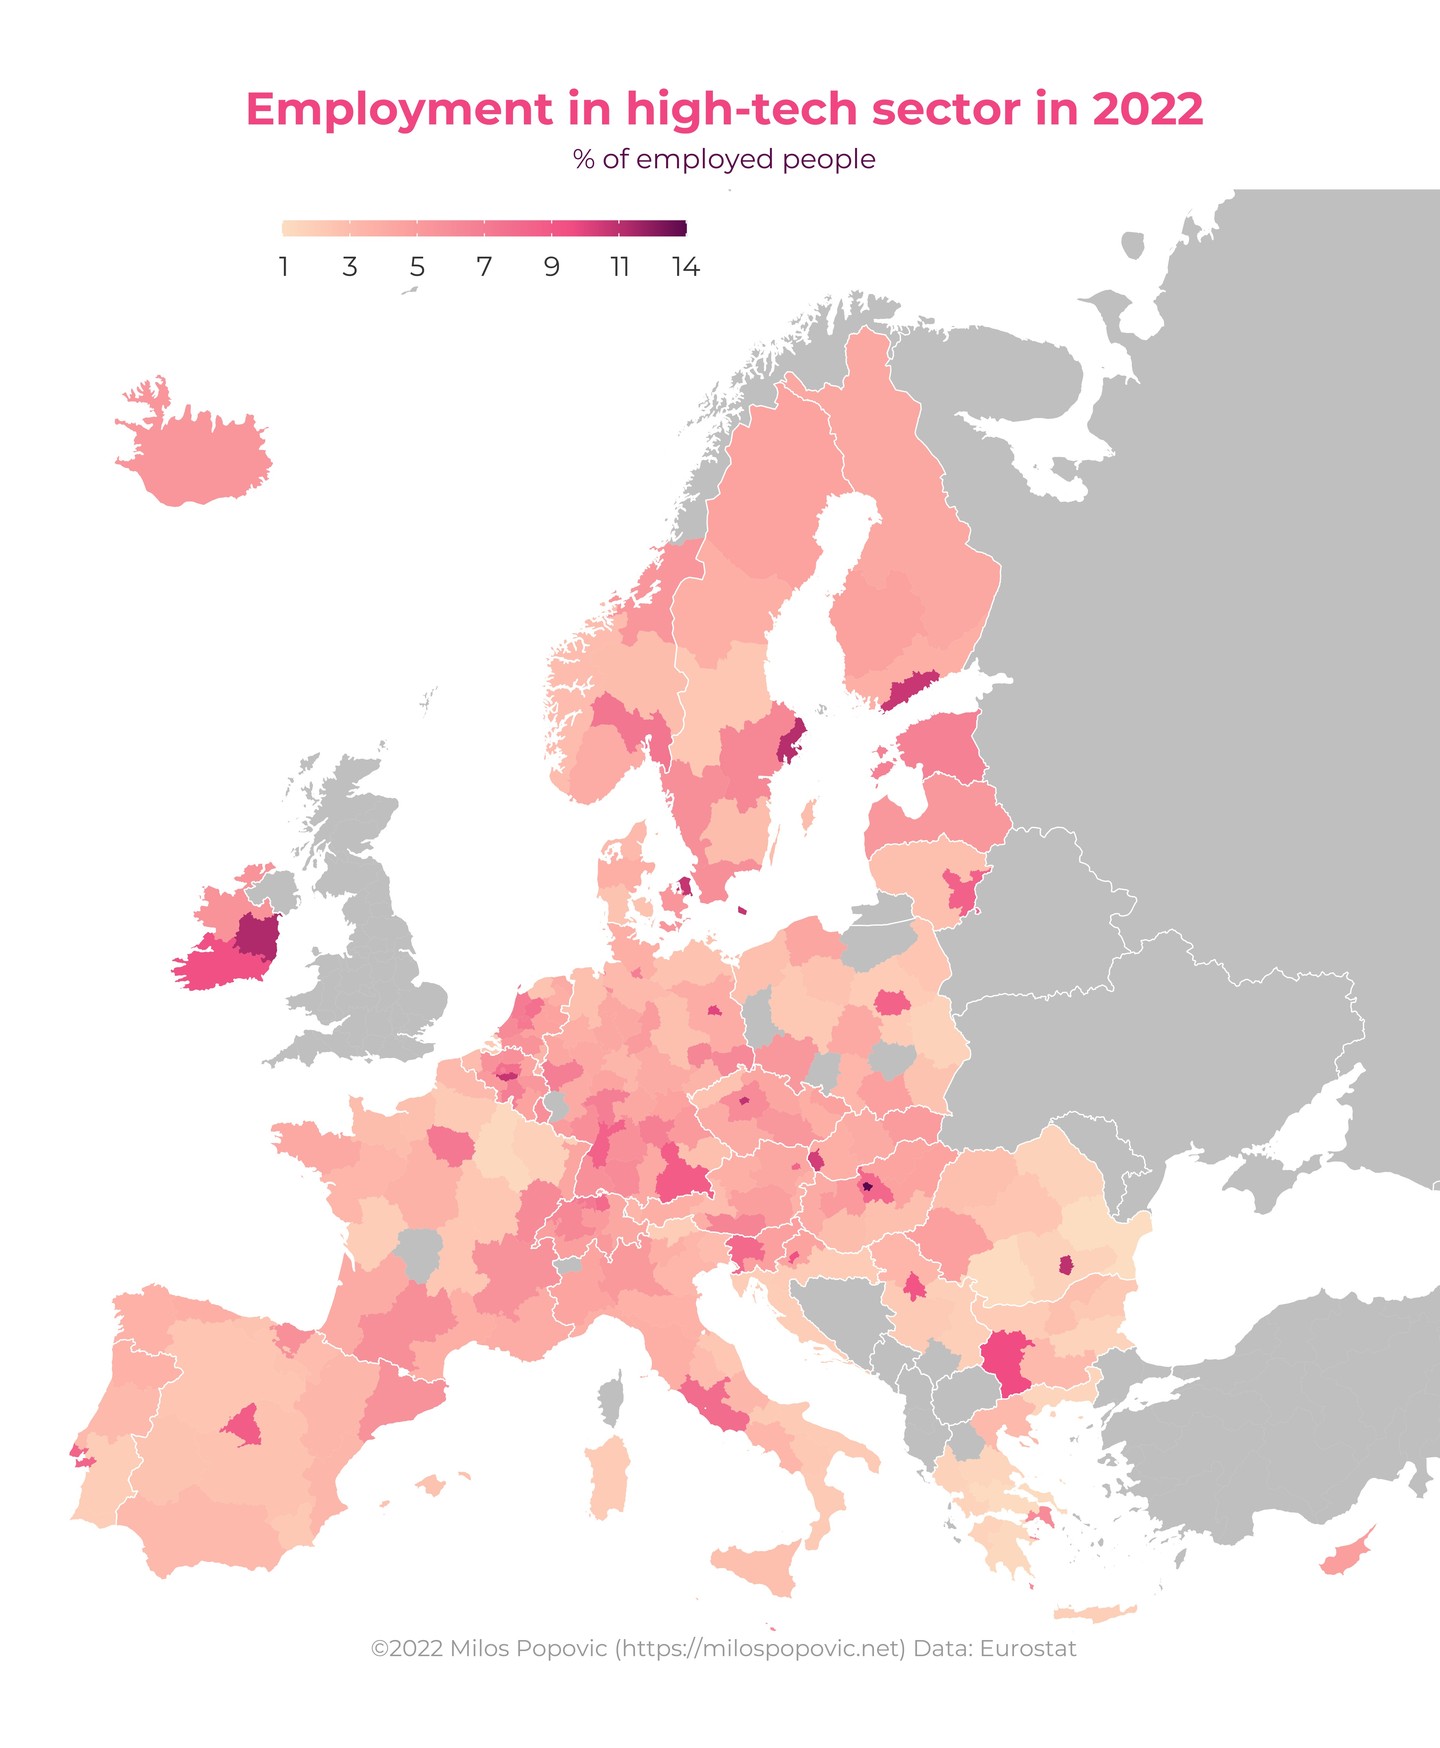
Employment in high-tech sector in 2022
Map

Employment in high-tech sector in 2022

A choropleth map of Europe showing the percentage of employed people working in the high-tech sector, by region. · Opens image in a new tab
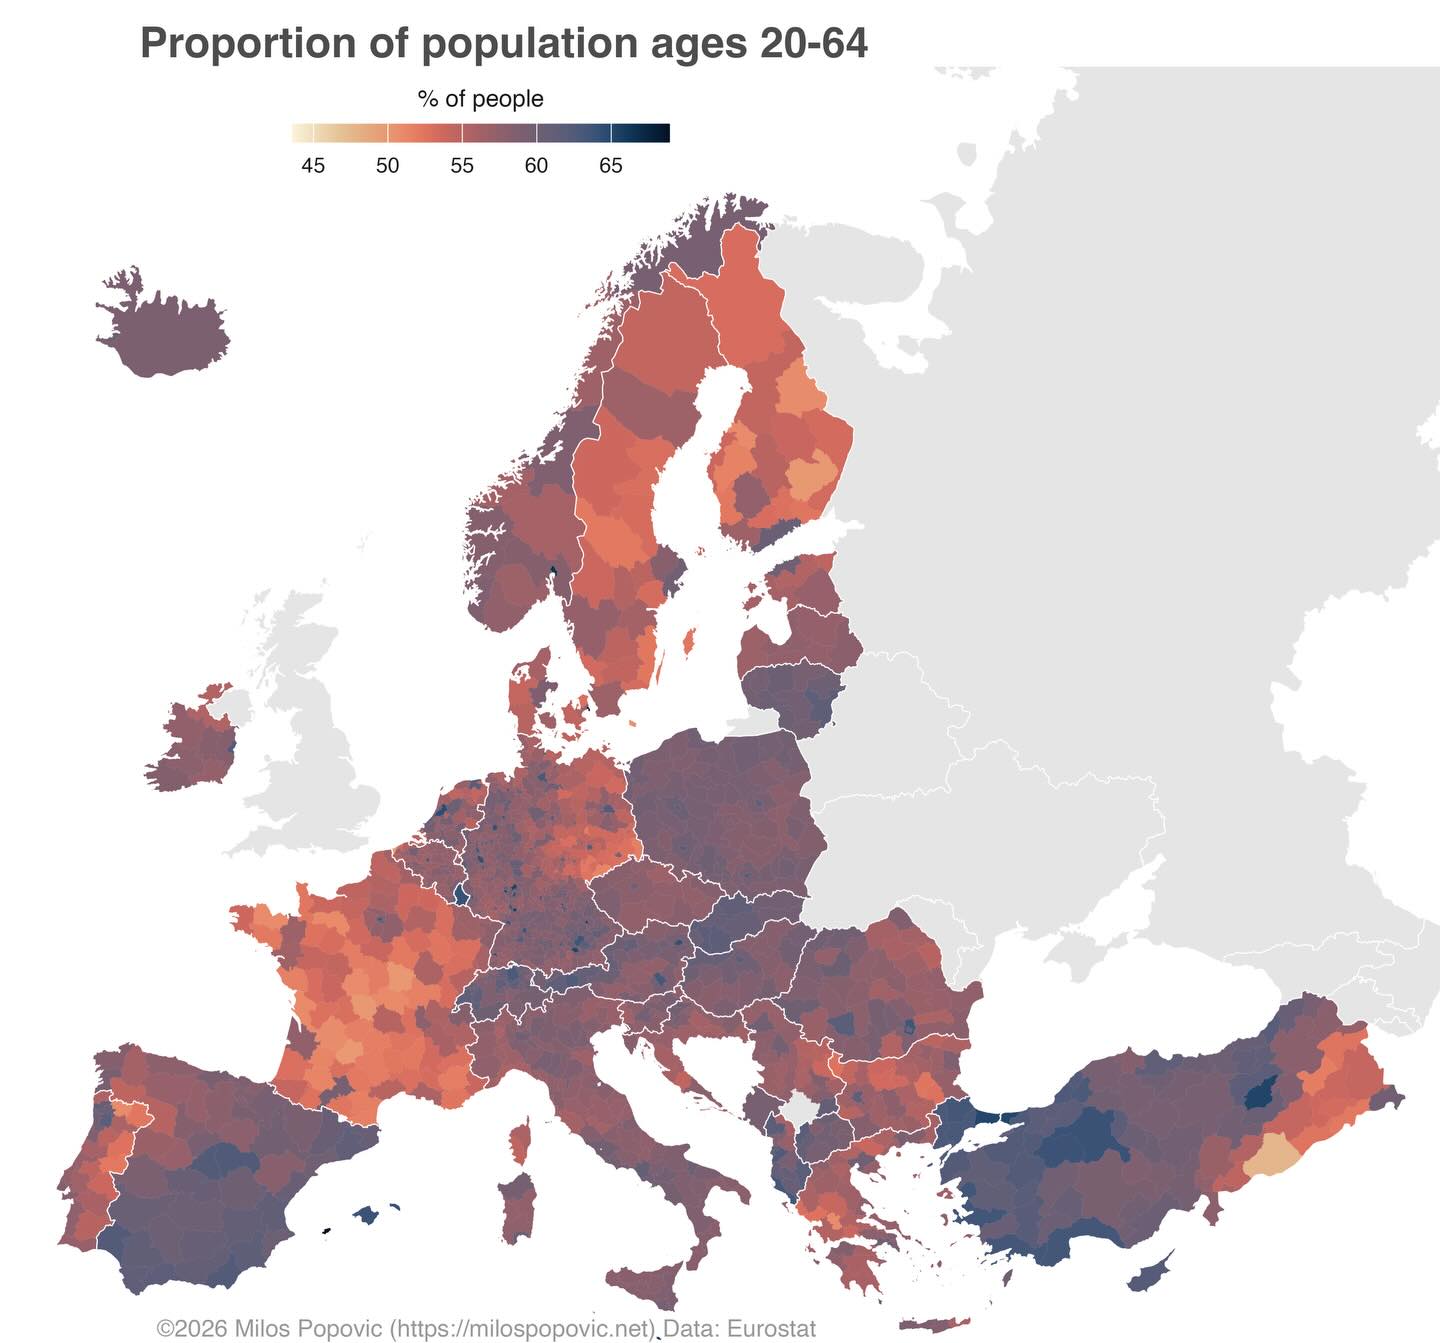
Proportion of population ages 20-64
Map

Proportion of population ages 20-64
A choropleth map of Europe showing the percentage of working-age population (20-64) across different regions. · Opens image in a new tab
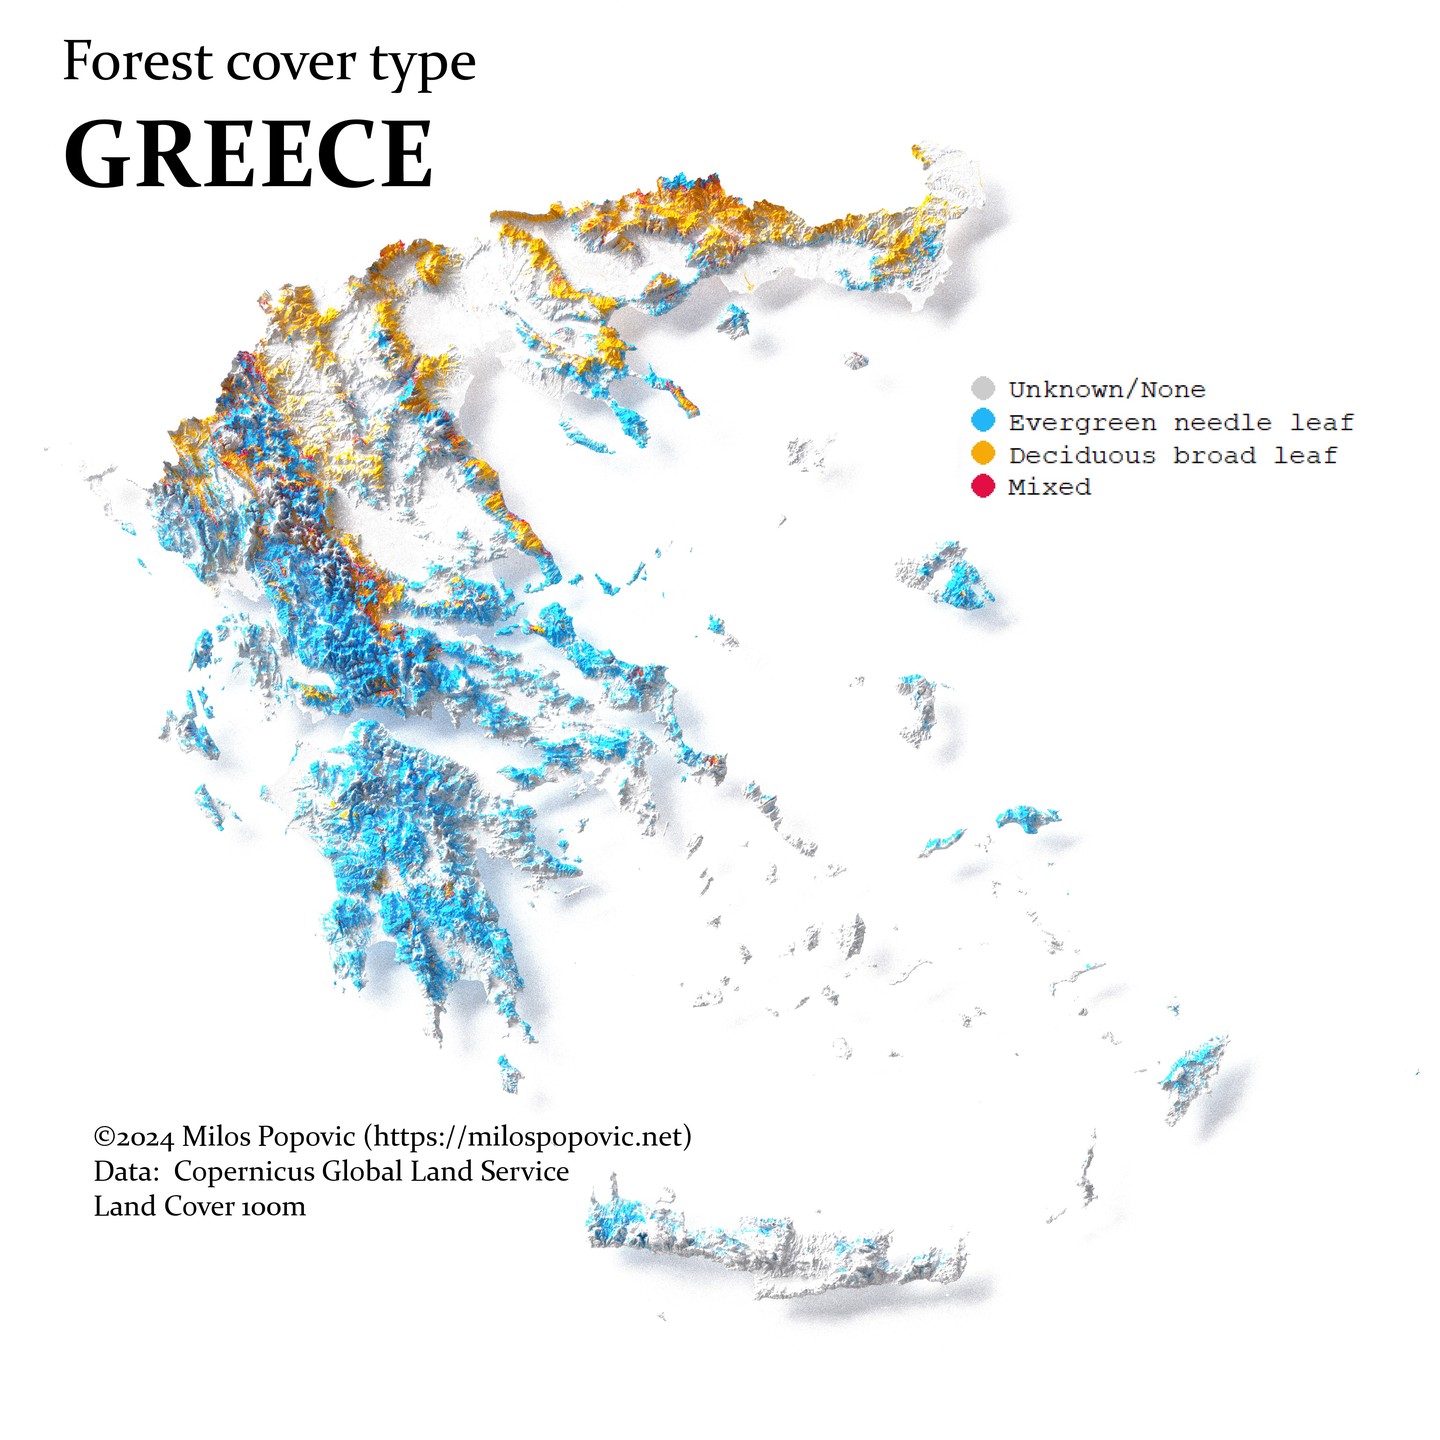
Forest cover type GREECE
3D map

Forest cover type GREECE

A 3D map of Greece showing forest cover types including evergreen needle leaf, deciduous broad leaf, and mixed forests. · Opens image in a new tab
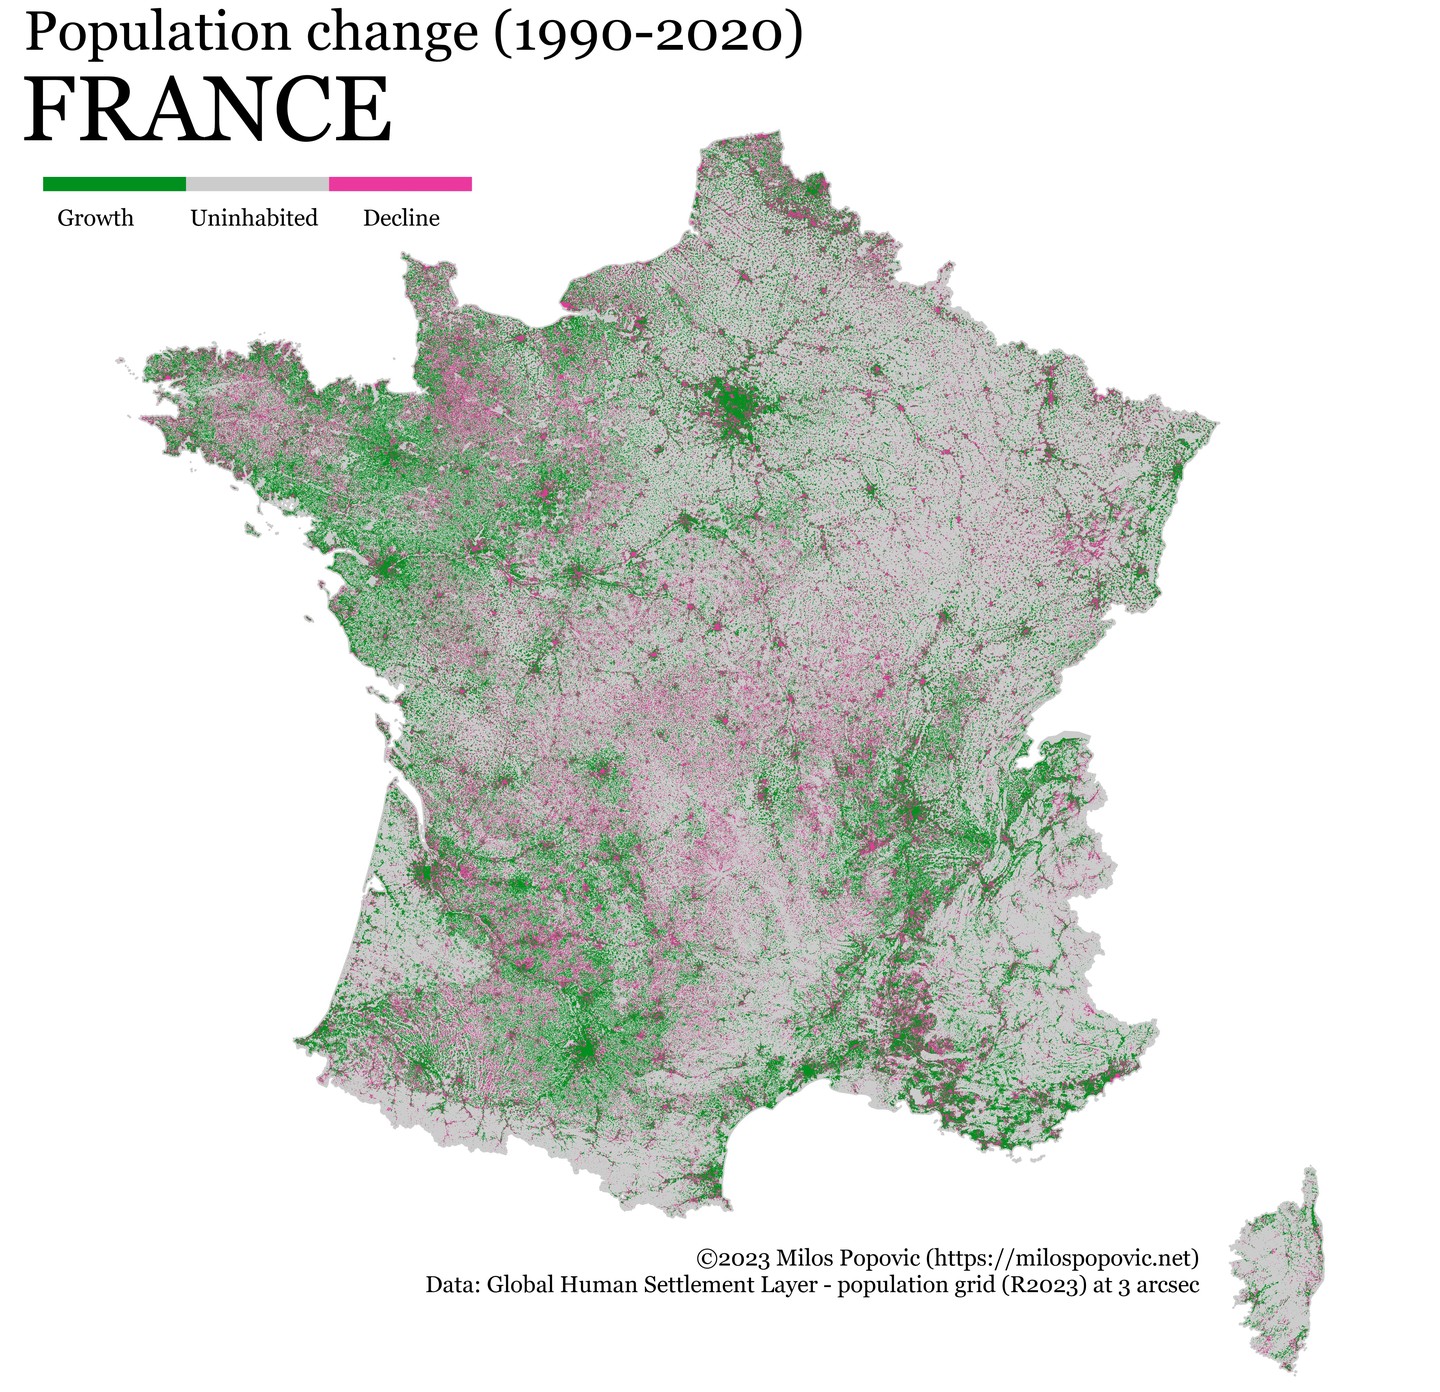
Population change (1990-2020) FRANCE
Map

Population change (1990-2020) FRANCE

A map of France showing population change between 1990 and 2020, with green indicating growth and pink indicating decline. · Opens image in a new tab